Summary
As markets contracted to their lowest levels in years, Venus Core Pool absorbed the shock cleanly. BNB fell 23%, 1,697 liquidation events seized $4.24M with full solvency along the drawdown. The book came out healthier, with less leverage: uncorrelated debt below a 1.1 health factor halved to $5.4M, and the liquidations were partial BTCB-led trims rather than a single-position cascade.
The liquidity contraction: total supply from $1.62B to $1.33B (-17.9%) and debt from $446.9M to $365.1M (-18.3%), is a price markdown, not a broad exit.
Two structural changes reinforced Venus’s security and ecosystem: The oracle backbone migrated to Atlas Oracle, and Venus listed its first tokenized-equity markets (Tesla, Nvidia and SpaceX).
1. Market Context & BNB Price
KPI Summary
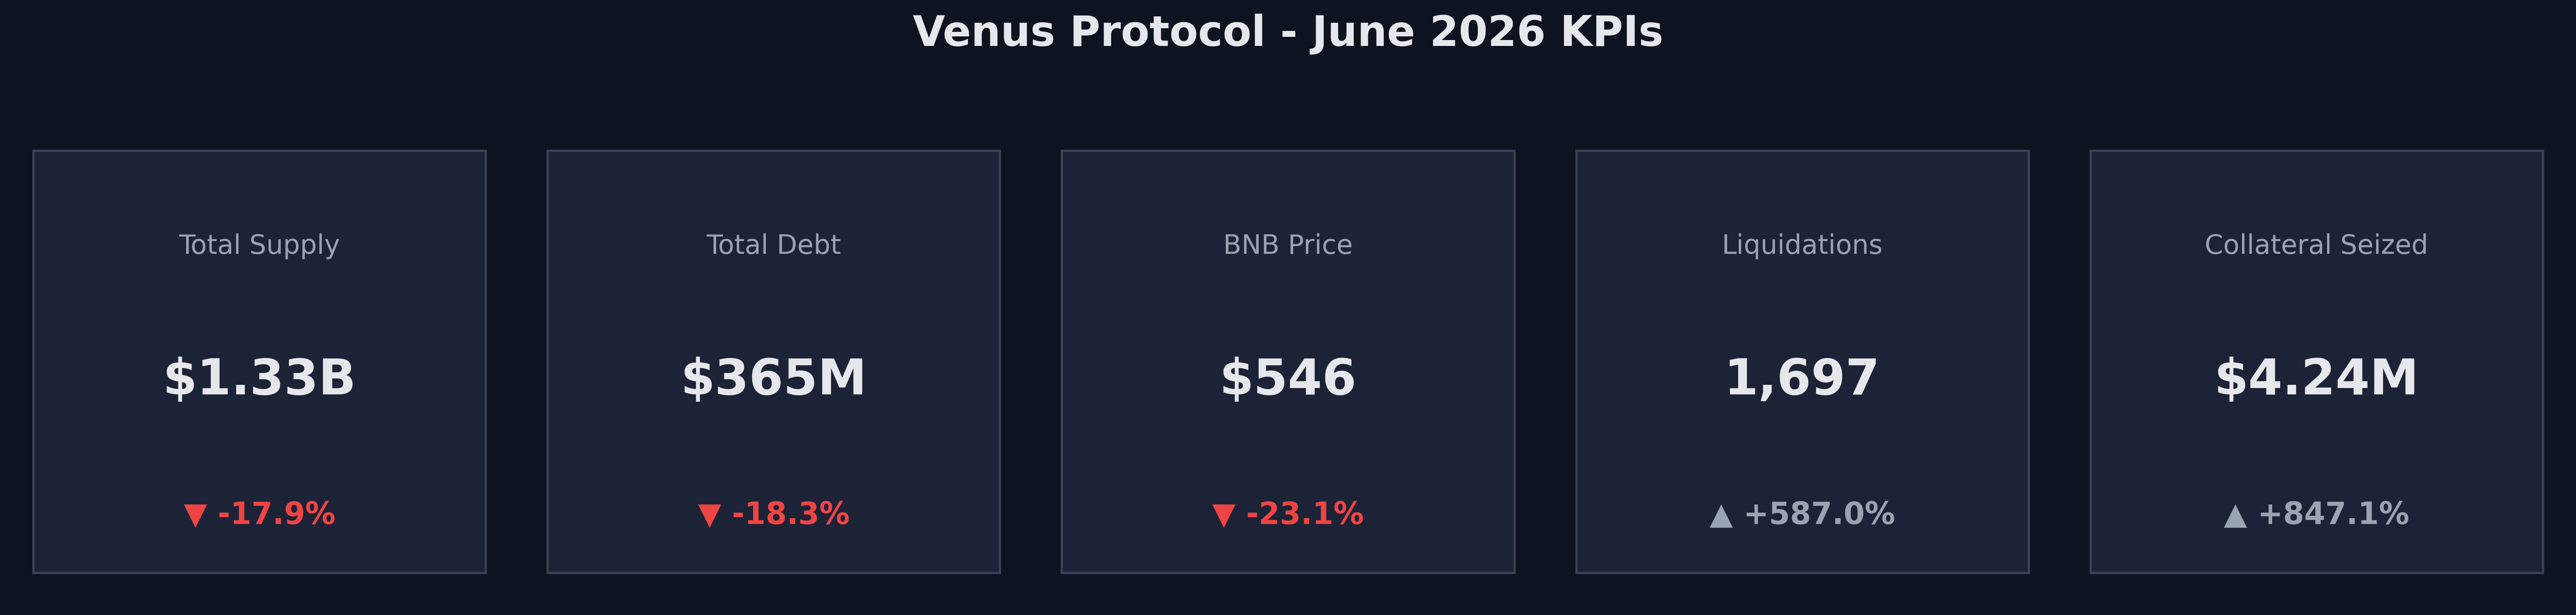
Venus Core Pool closed June 30 with:
- Total Supply: $1.333B (-17.9%)
- Total Debt: $365.1M (-18.3%)
- BNB Price: $546 (-23.1%)
- Liquidations: 1,697 events (+587.0%)
- Collateral Seized: $4.24M (+847.1%)
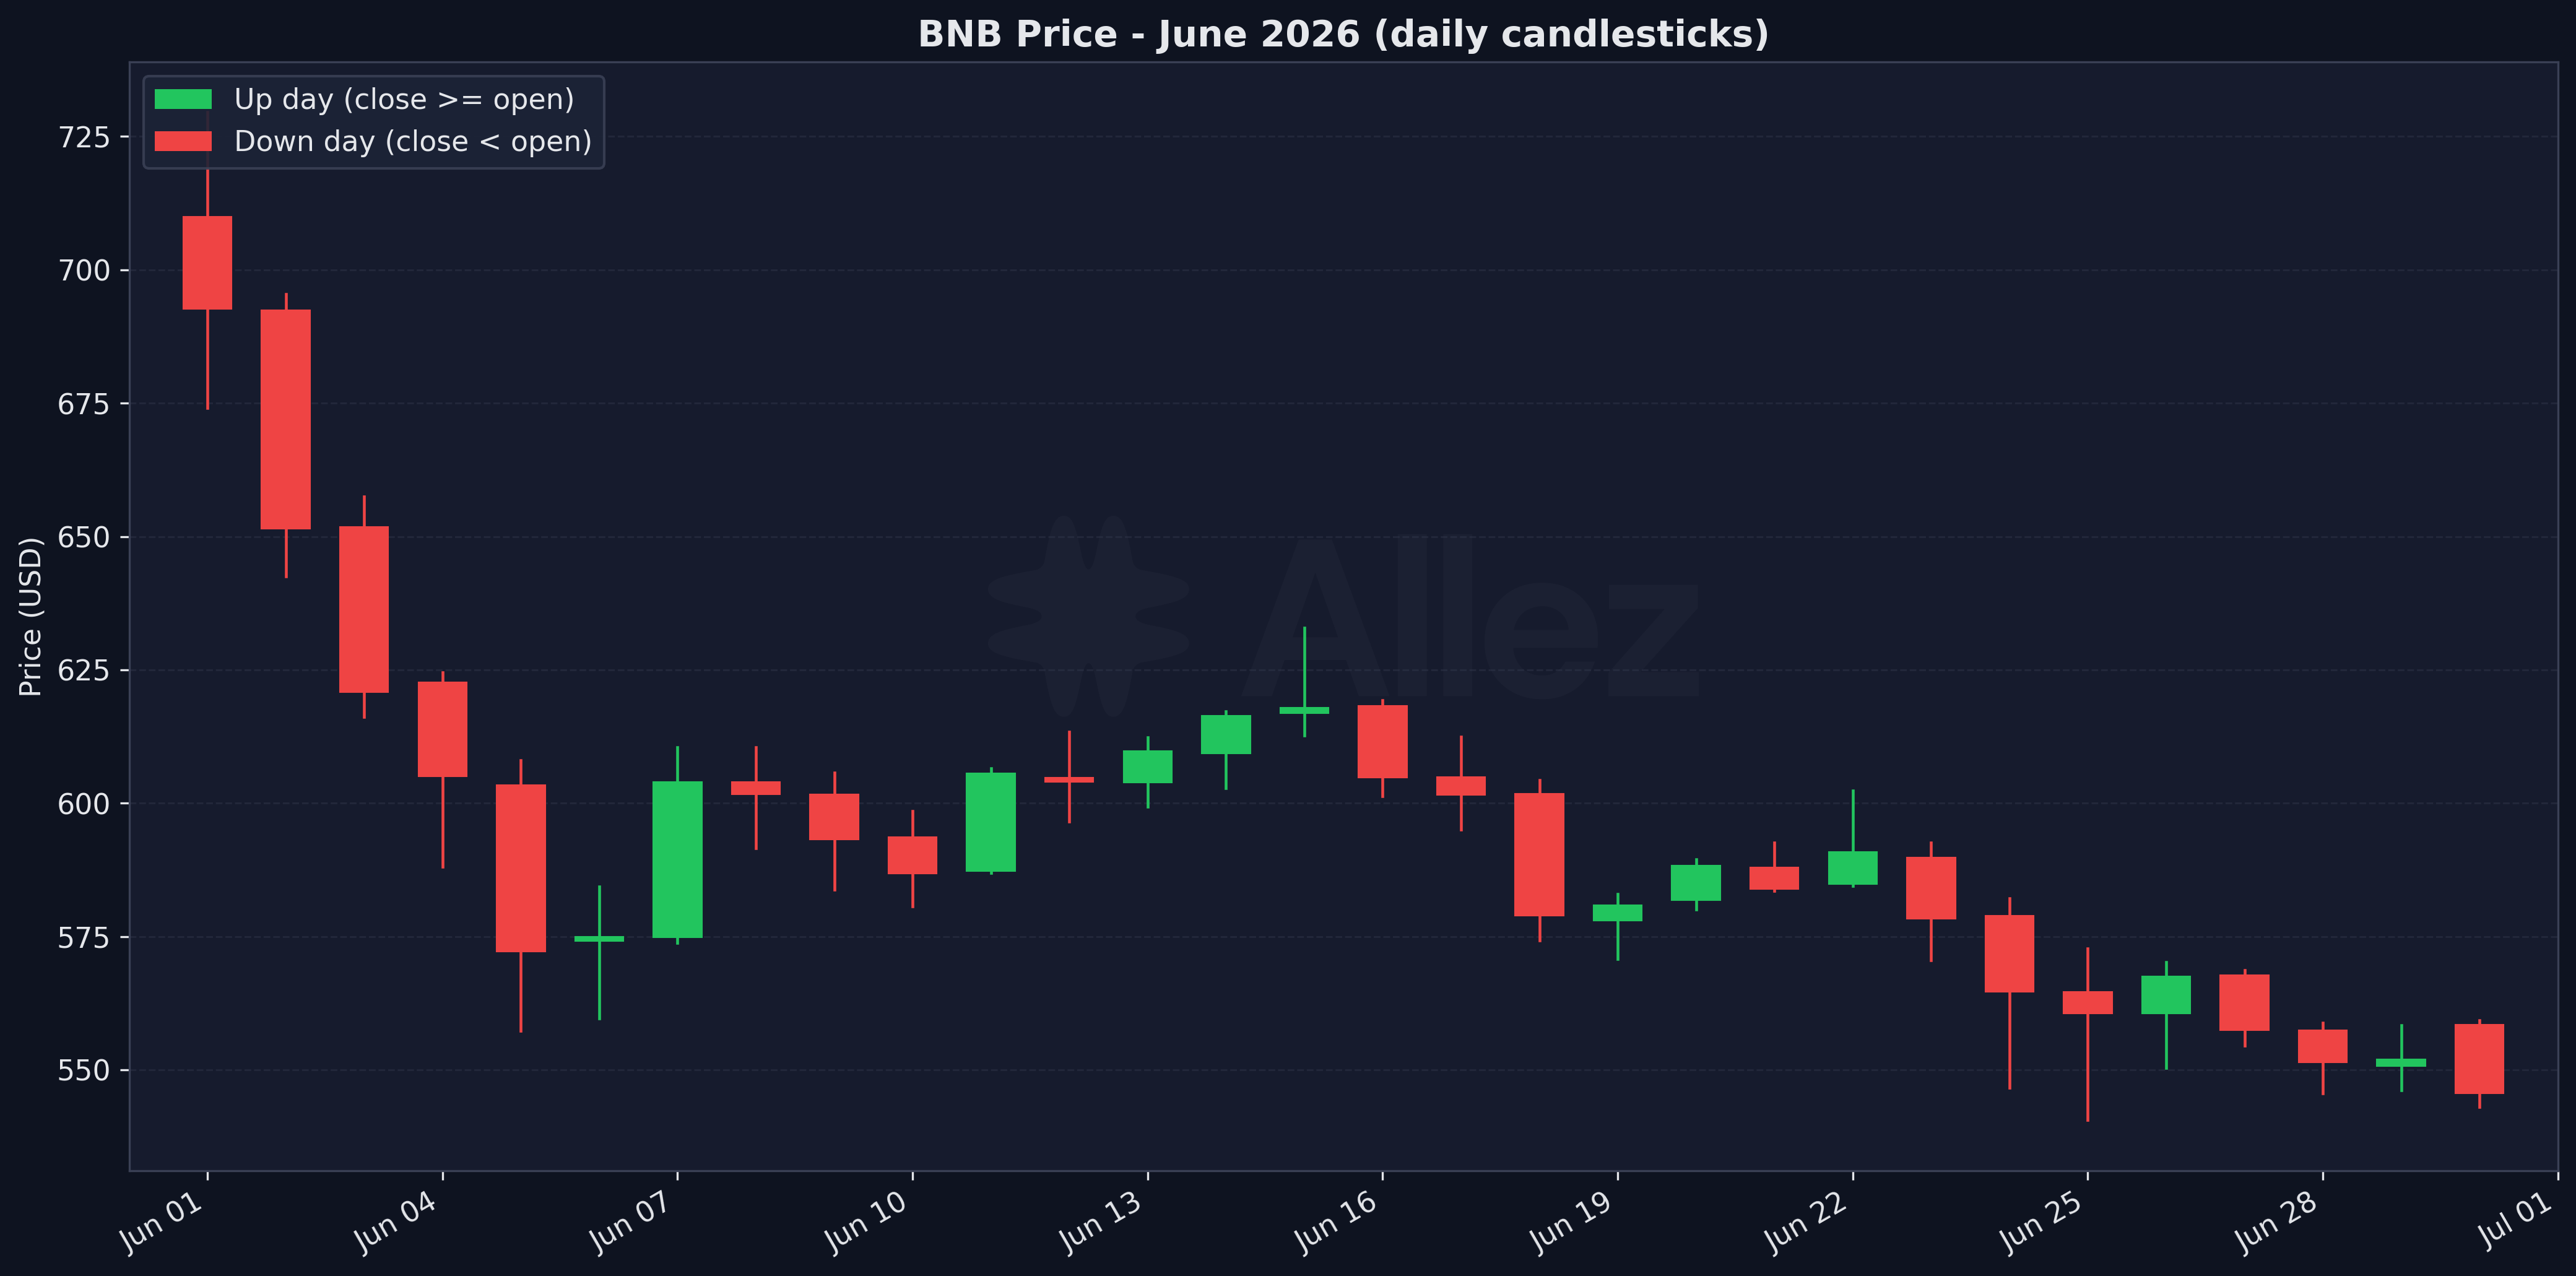
June retraced May’s rally in a broad-market move. BNB fell from $710 to $546, with BTC and ETH lower alongside it and the selling concentrated in the first week (June 2 alone drove nearly half the month’s seized collateral). With BNB-correlated assets (BNB, WBNB, asBNB, slisBNB) and the BTC complex at ~72% of deposits, the pullback marked down supply and debt while token balances held. A repricing, not a flight of deposits.
The flow data confirms this. Gross activity was heavy, but net movement was small against the $1.33B book:
| Flow | Gross (June) | Transactions | Txns MoM |
|---|---|---|---|
| Supply | $320.6M | 27,409 | +3.4% |
| Withdraw | $321.7M | 23,072 | +10.6% |
| Borrow | $661.4M | 96,496 | +51.5% |
| Repay | $684.8M | 80,879 | +92.7% |
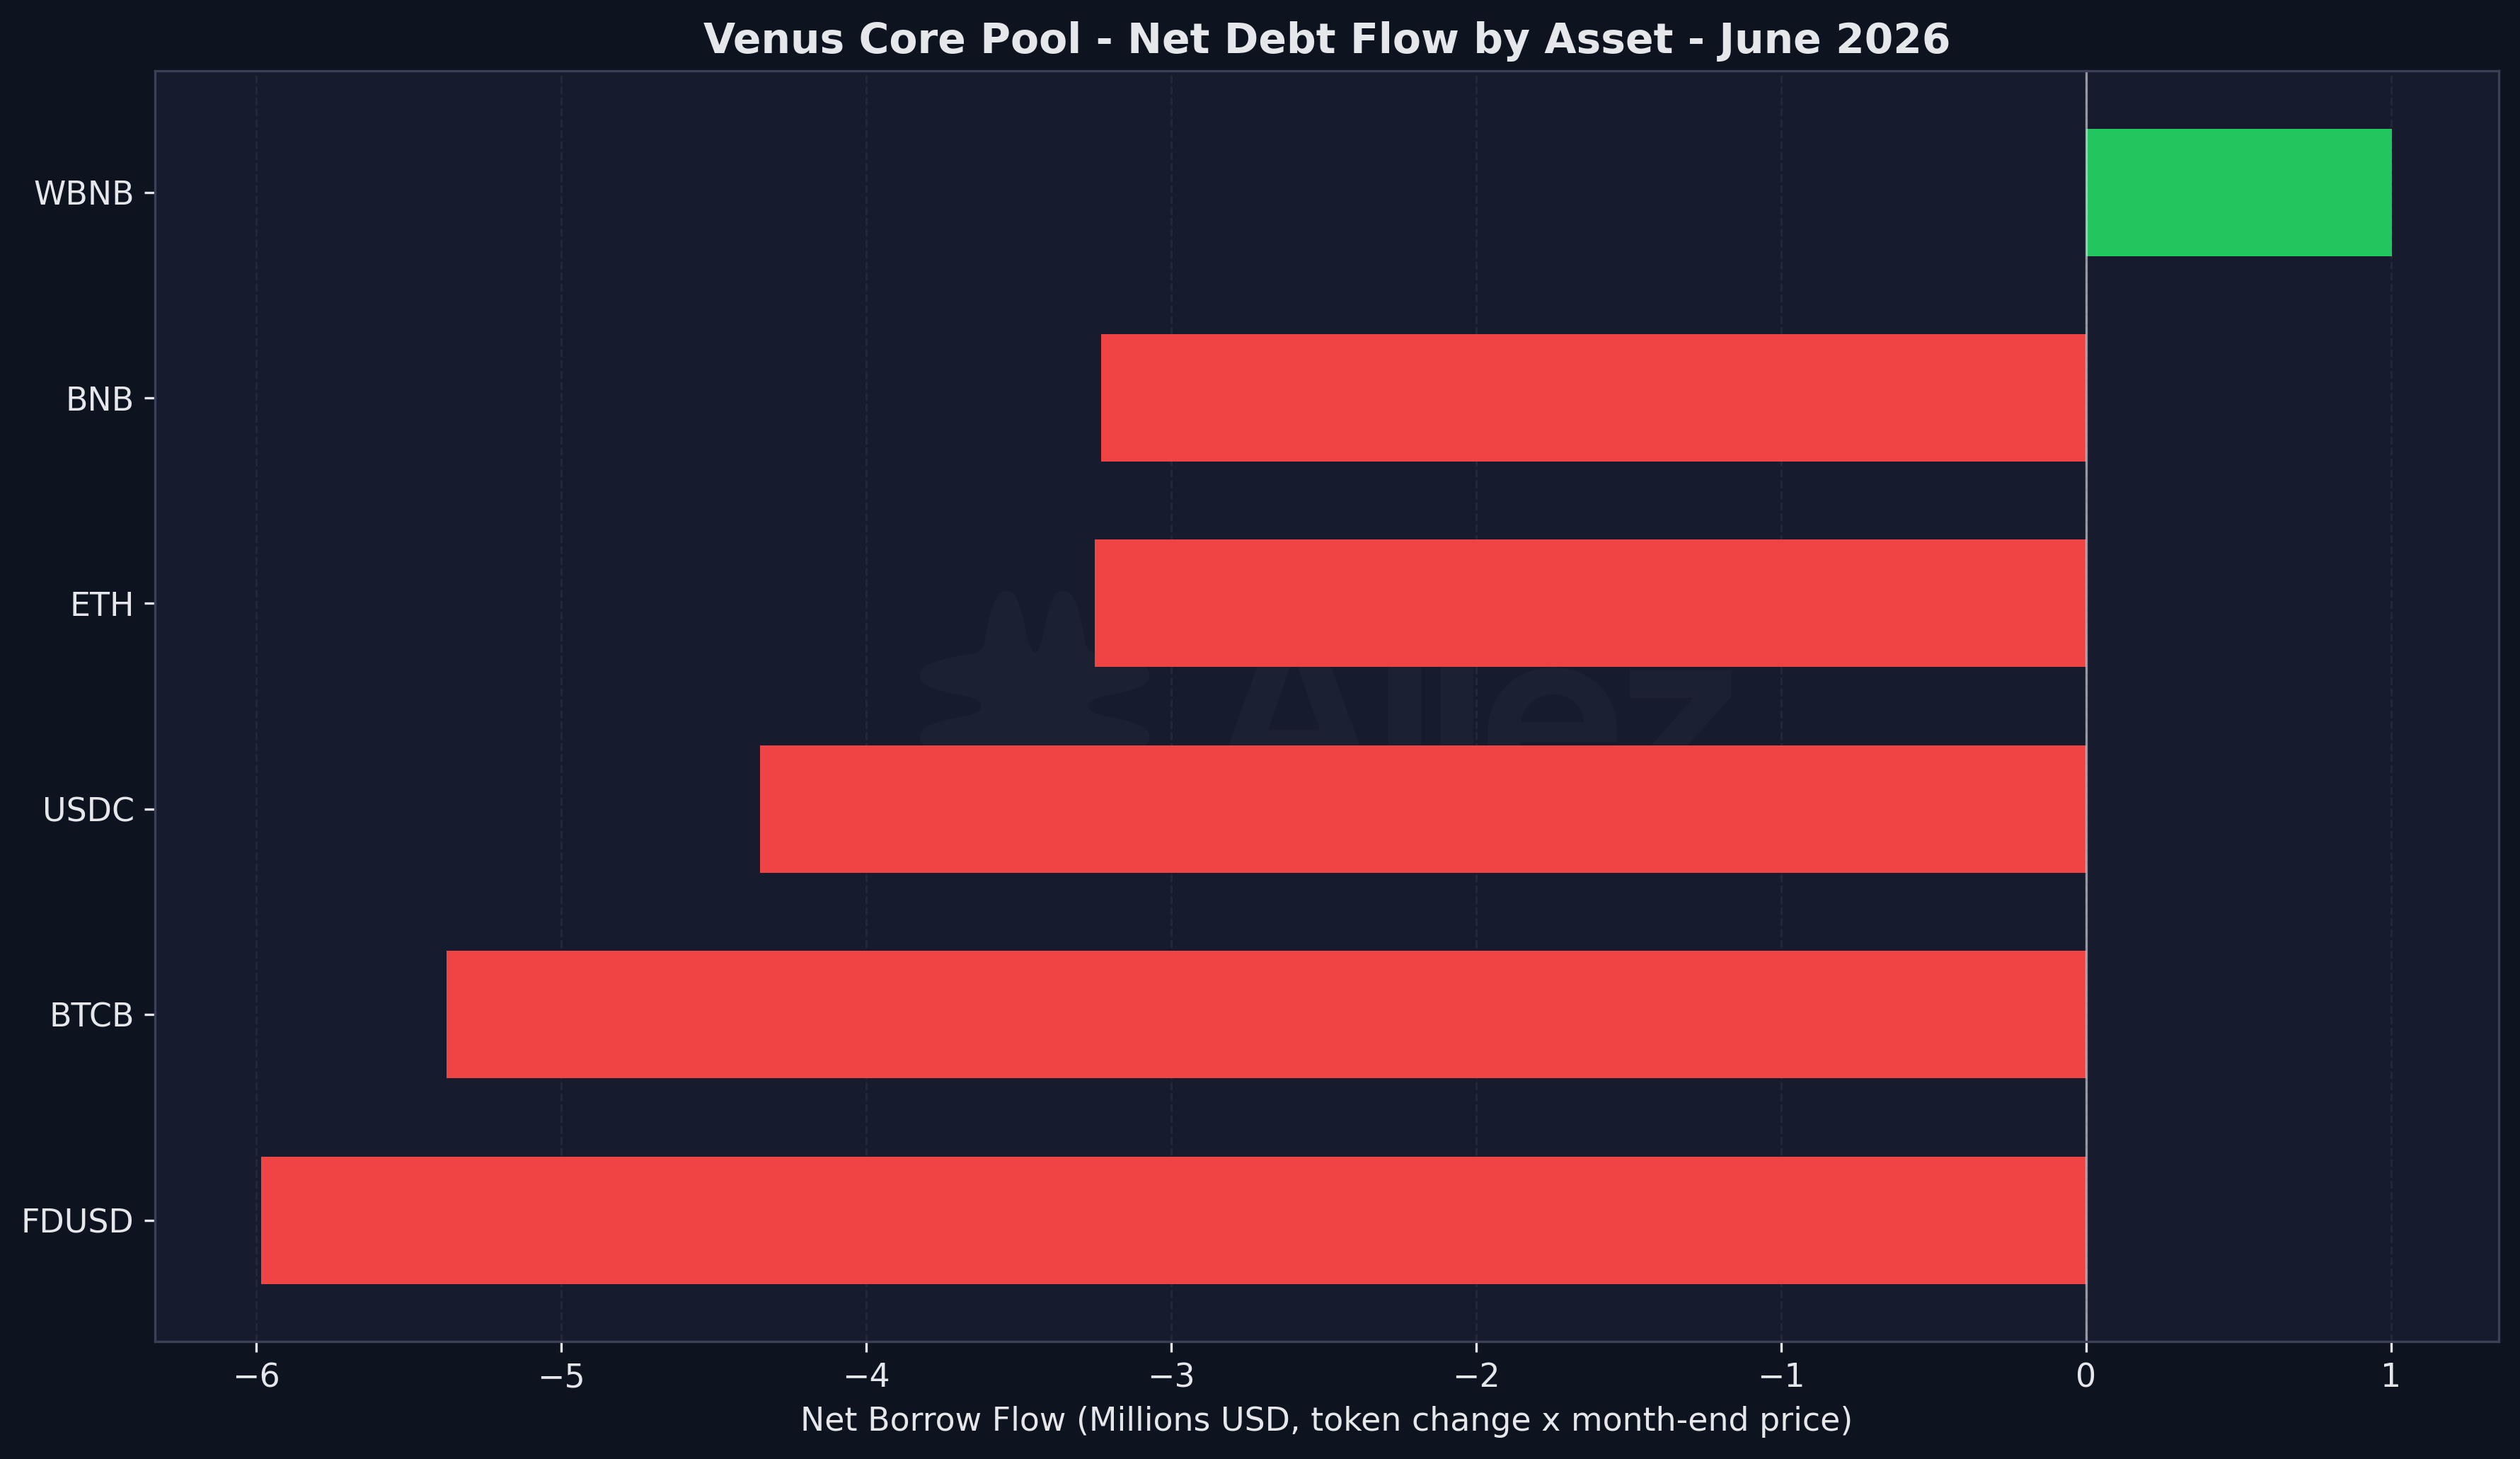
Net deposit flow (supply minus withdraw): -$1.1M. Net borrow flow (borrow minus repay): -$23.4M. The month-over-month column counts transactions: supply and withdrawal activity was roughly flat (+3.4% and +10.6%), while borrow and repay counts jumped 51.5% and 92.7% as borrowers actively managed positions through the drawdown.
Deposits and withdrawals nearly balanced, so the roughly $290M supply decline was almost entirely price rather than exit, with stable nominal amounts covered in Section 2. Borrowing ran a net $23.4M repayment, the modest deleveraging that shows up in the E-mode loops in Sections 3 and 4. These volumes are priced at transaction time, so equal gross dollar flows in a falling market imply slightly more tokens withdrawn than deposited; the load-bearing evidence for “price, not exit” is the token-quantity view in Section 2, which the flow balance corroborates.
Venus Ecosystem Updates:
- Tokenized-equity markets listed: Tesla (TSLAB), Nvidia (NVDAB) and SpaceX (SPCXB), covered in Section 2. (forum)
- Oracle migration: Atlas, a CoinMarketCap-backed oracle provider, replaced the legacy Binance Oracle as Venus’s primary configurable price-feed layer. It went live mid-June, alongside expanded Chainlink OEV coverage and RedStone anchors. (forum)
- Parameter Risk Adjustments (published June 23): Allez recommended collateral-factor reductions across volatile assets, liquid-staking tokens and stablecoins. Liquidation thresholds were unchanged, so no existing position liquidated; the cuts cap new borrow power against collateral that is harder to liquidate at size, for the volatile and LST collateral that produced most of June’s seizures. (forum)
- Venus Prime redesign executed: lifetime Prime NFTs replaced with a monthly leaderboard (PrimeV2), with the June allocation adding wBNB alongside USDT. (forum)
- Multi-chain deprecated-market parameter update (Step 1 of 2): reserve factors raised on off-boarded markets outside the BNB Core Pool. (forum)
The month’s main structural change was the oracle migration. The Core Pool now prices through Atlas, a CoinMarketCap-backed oracle provider, backed by Chainlink OEV and RedStone anchors, replacing the legacy Binance Oracle. It went live mid-June, after the June 2 liquidation peak, so it has not yet priced through a stress event; its first full month is July’s headline watch item (Section 6).
2. Supply & Market Overview
New this month: tokenized equities arrive on Venus (bStocks)
June opened an entirely new asset class on Venus: its first tokenized US equities, Tesla (TSLAB) and Nvidia (NVDAB) from June 20 and SpaceX (SPCXB) from June 23, bringing equity exposure on-chain as Core Pool collateral for the first time.
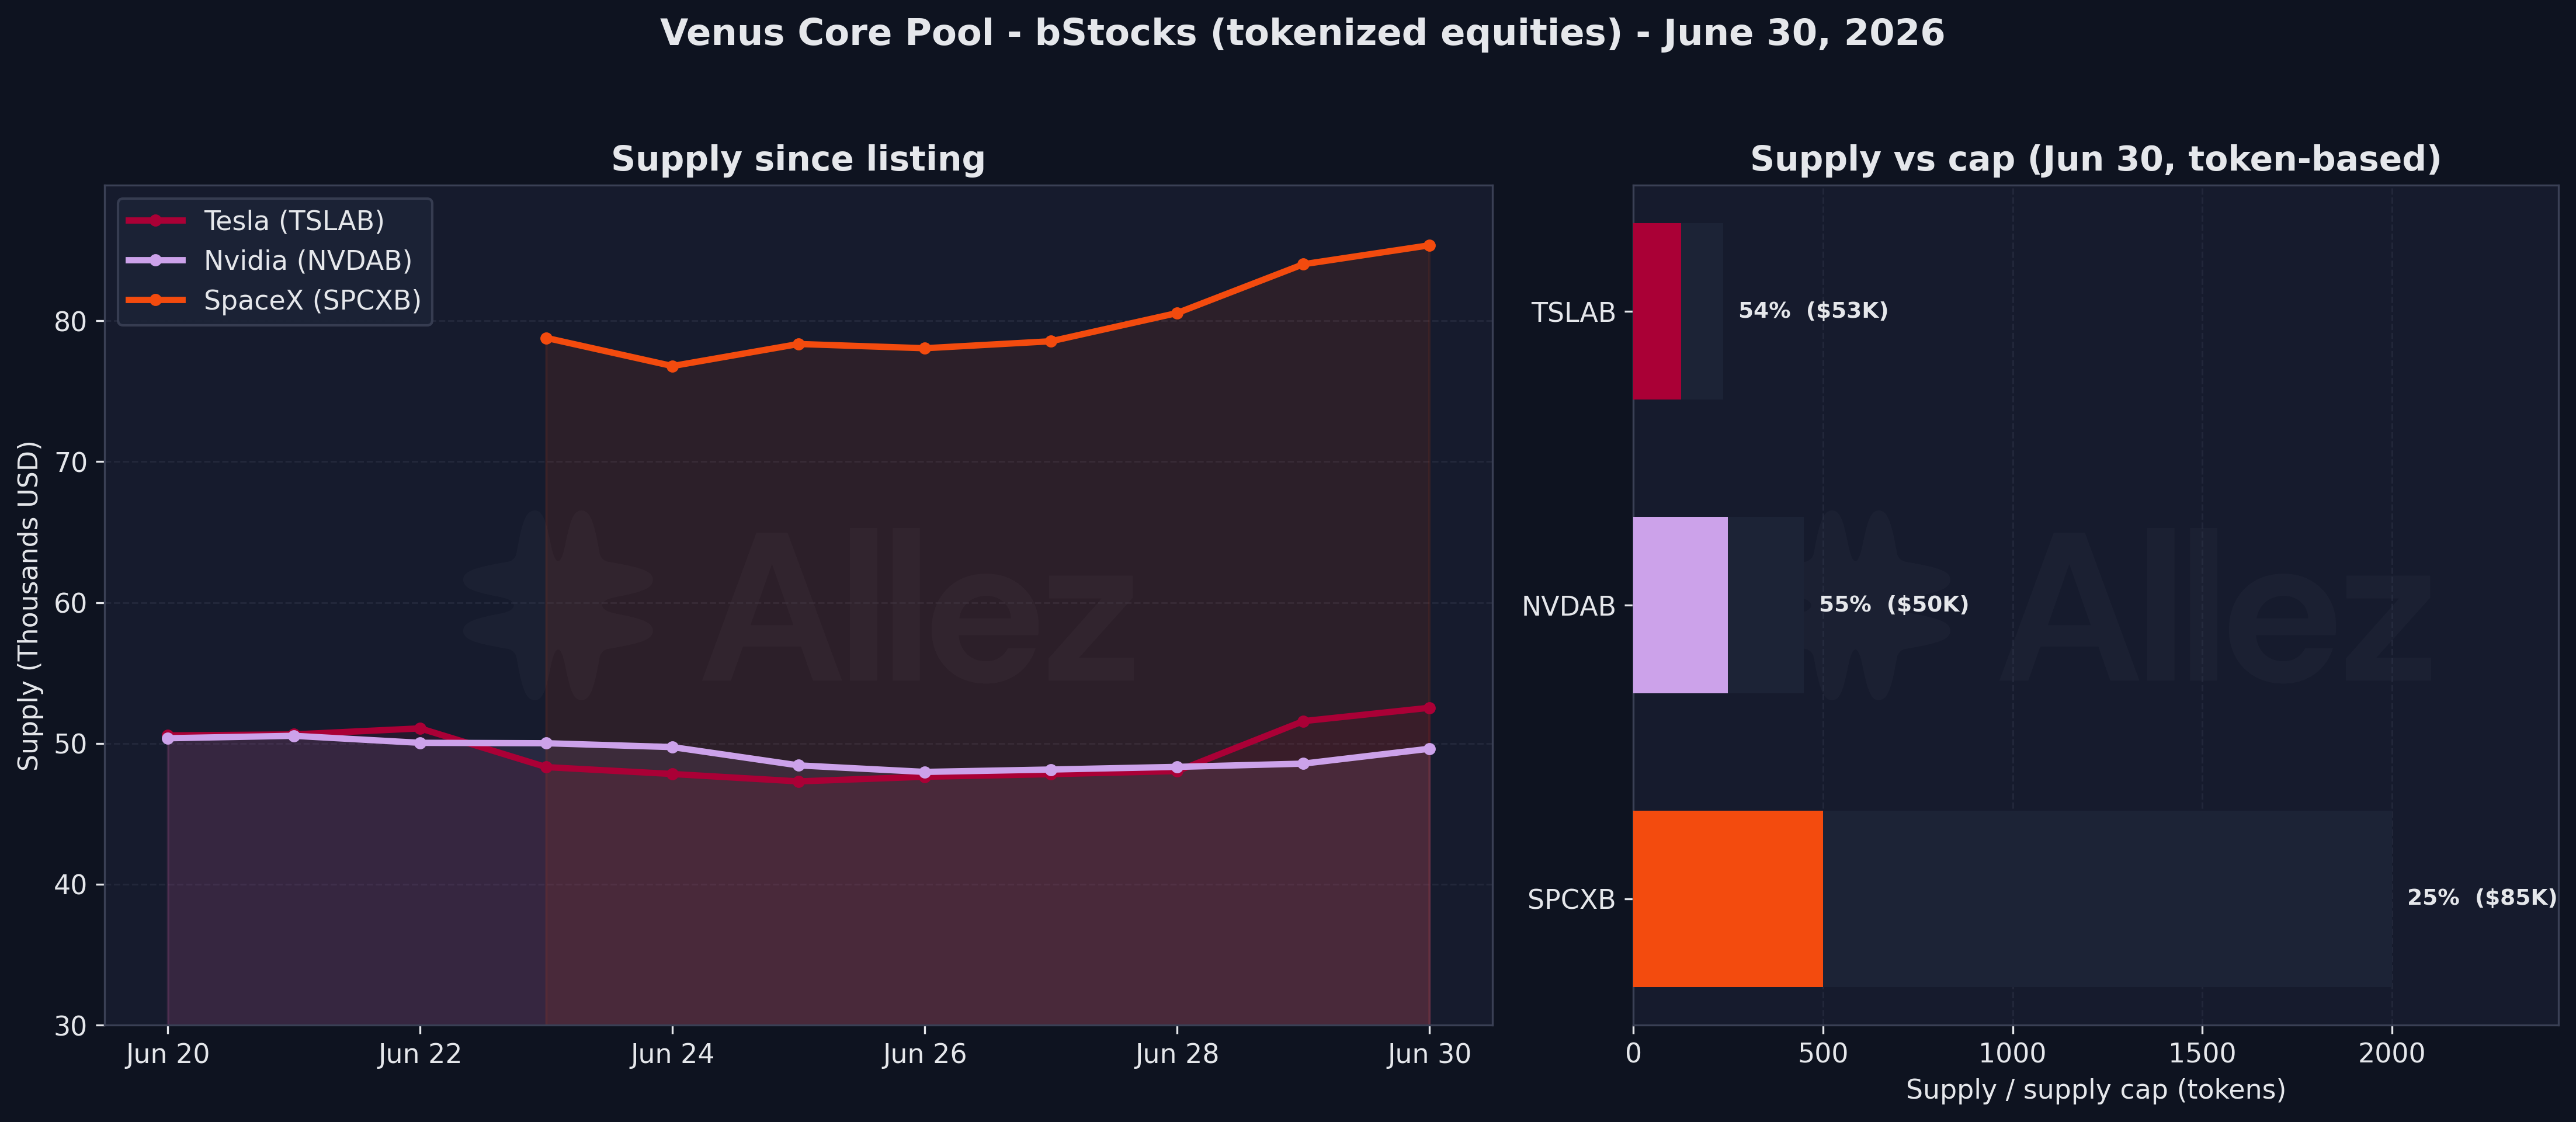
The underlying tokens are Binance-issued tokenized securities, with on-chain liquidity routed through PancakeSwap X (an RFQ aggregator) rather than a native pool. All three launched conservatively: collateral factors of 60% for TSLAB and NVDAB and 50% for SPCXB, a 10% reserve factor, and small supply caps worth roughly $98K (TSLAB), $90K (NVDAB) and $341K (SPCXB) at end-June prices. By June 30 they held $53K, $50K and $85K of supply respectively and carried zero borrow, so Tesla and Nvidia are already above half their caps while SpaceX sits near a quarter. Tokenized equities on-chain liquidity is growing at unprecedented speed and Venus is ready to meet demand. The market is still small and unleveraged with immaterial risks.
On exit depth for these new markets, the risk is bounded on two fronts. The supply caps hold the maximum liquidatable size for each equity market to roughly $100K to $340K, and with zero borrow today there is nothing to liquidate.
The one structural watch-item is the liquidity venue: PancakeSwap X is an RFQ aggregator, so liquidity is quoted by market makers on demand rather than sitting in a standing pool with readable depth, and tokenized equities do not trade on weekends while the loan market runs continuously. If borrow demand develops against these markets, a liquidation could land in a window where maker quotes are thin or the reference market is closed. Caps should track observed depth across conditions rather than point-in-time liquidity. That is a reason to keep the caps small until quoted depth is demonstrated, not a live exposure.
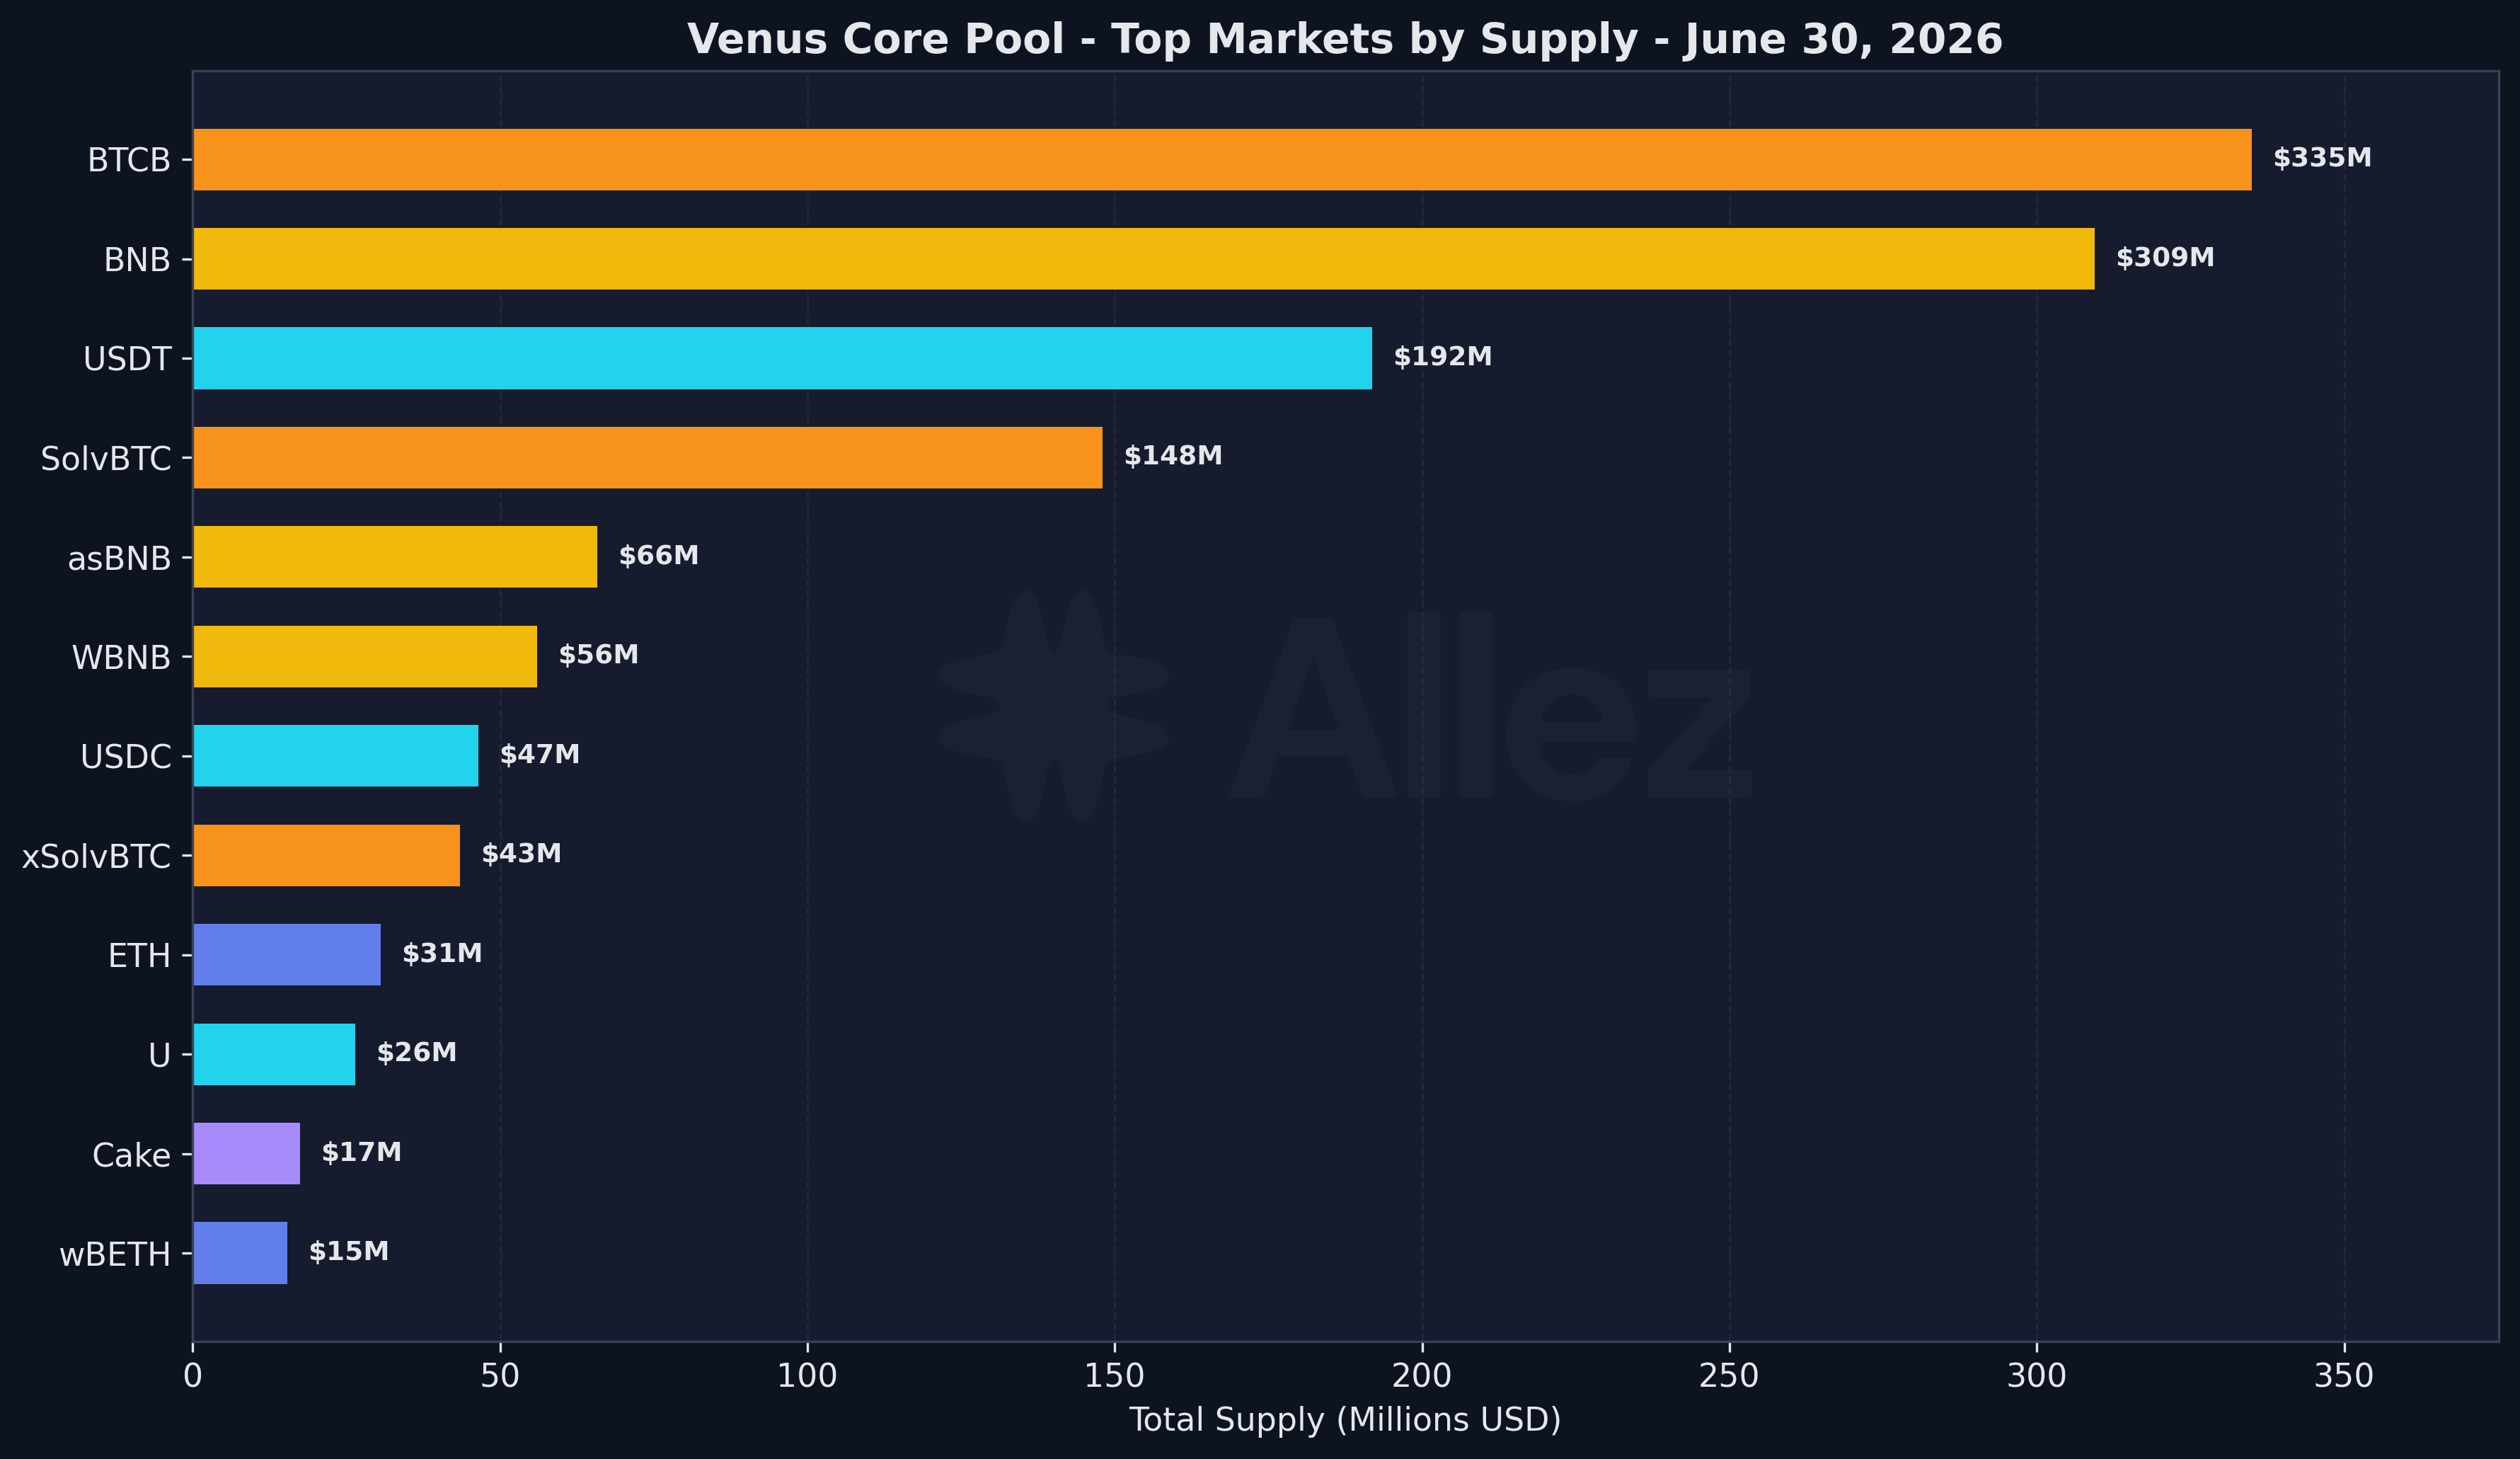
Top markets by supply (June 30):
| Market | Supply | MoM | Debt | Util |
|---|---|---|---|---|
| BTCB | $335M | -14.8% | $90M | 27.0% |
| BNB | $309M | -23.4% | $86M | 27.7% |
| USDT | $192M | -6.6% | $119M | 61.8% |
| SolvBTC | $148M | -19.9% | $0M | 0.1% |
| asBNB | $66M | -28.7% | $0M | 0.0% |
| WBNB | $56M | -19.0% | $10M | 17.7% |
| USDC | $47M | -8.6% | $28M | 59.5% |
| xSolvBTC | $43M | -21.3% | $0M | 0.0% |
| ETH | $31M | -24.0% | $12M | 39.0% |
| U | $26M | -8.3% | $13M | 47.8% |
Most of the dollar declines are price, not flight. In token terms, BTCB was the largest real inflow, adding $23.5M of deposits even as its dollar supply fell 14.8% on the BTC price drop, while SolvBTC and WBNB also saw net token inflows. The outflows were led by USDT (-$13.6M), asBNB (-$5.0M), FDUSD (-$4.5M) and USDC (-$4.4M). June was mostly a price markdown, with rotation between assets underneath.
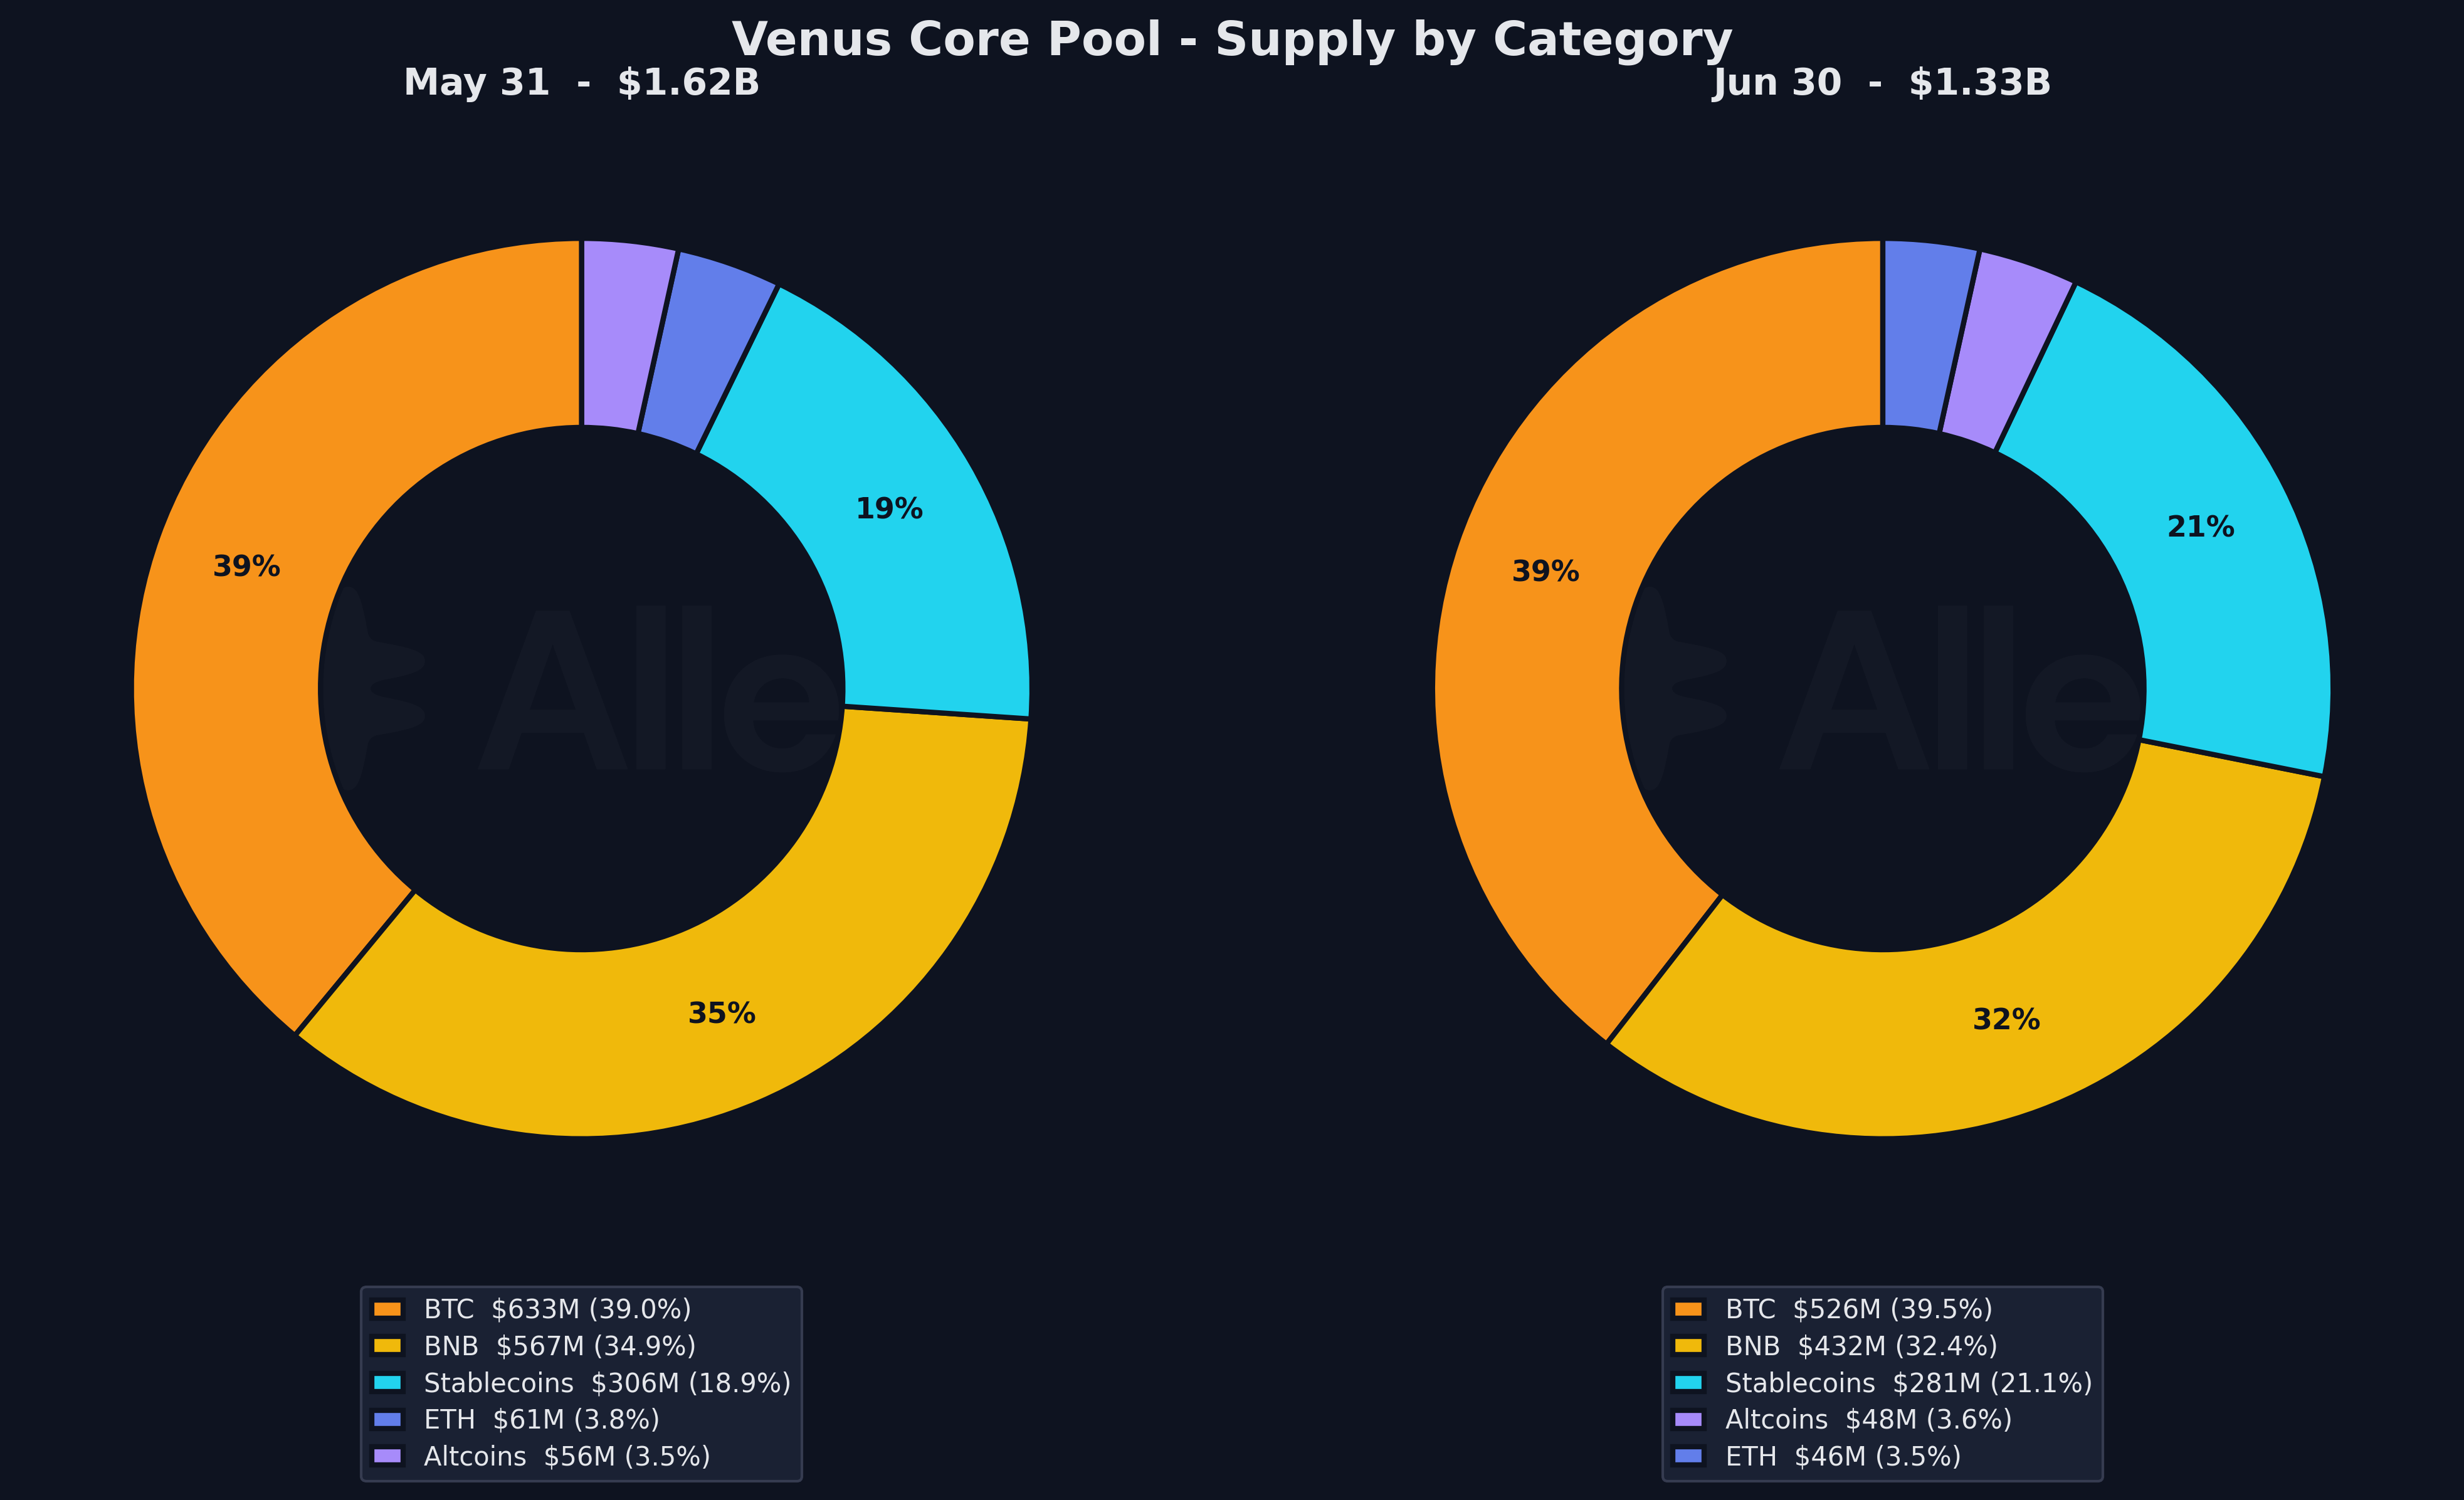
Category composition (June 30):
| Category | Supply | Share | MoM (pp) | Debt |
|---|---|---|---|---|
| BTC | $526M | 39.5% | +0.5 | $91M |
| BNB | $432M | 32.4% | -2.5 | $96M |
| Stablecoins | $281M | 21.1% | +2.2 | $165M |
| ETH | $46M | 3.5% | -0.3 | $12M |
| Altcoins | $48M | 3.6% | +0.1 | $2M |
BNB’s share gave back 2.5 points on the 23% price drop, while BTC held its lead and stablecoins gained 2 points as their dollar value held up against the falling crypto book.
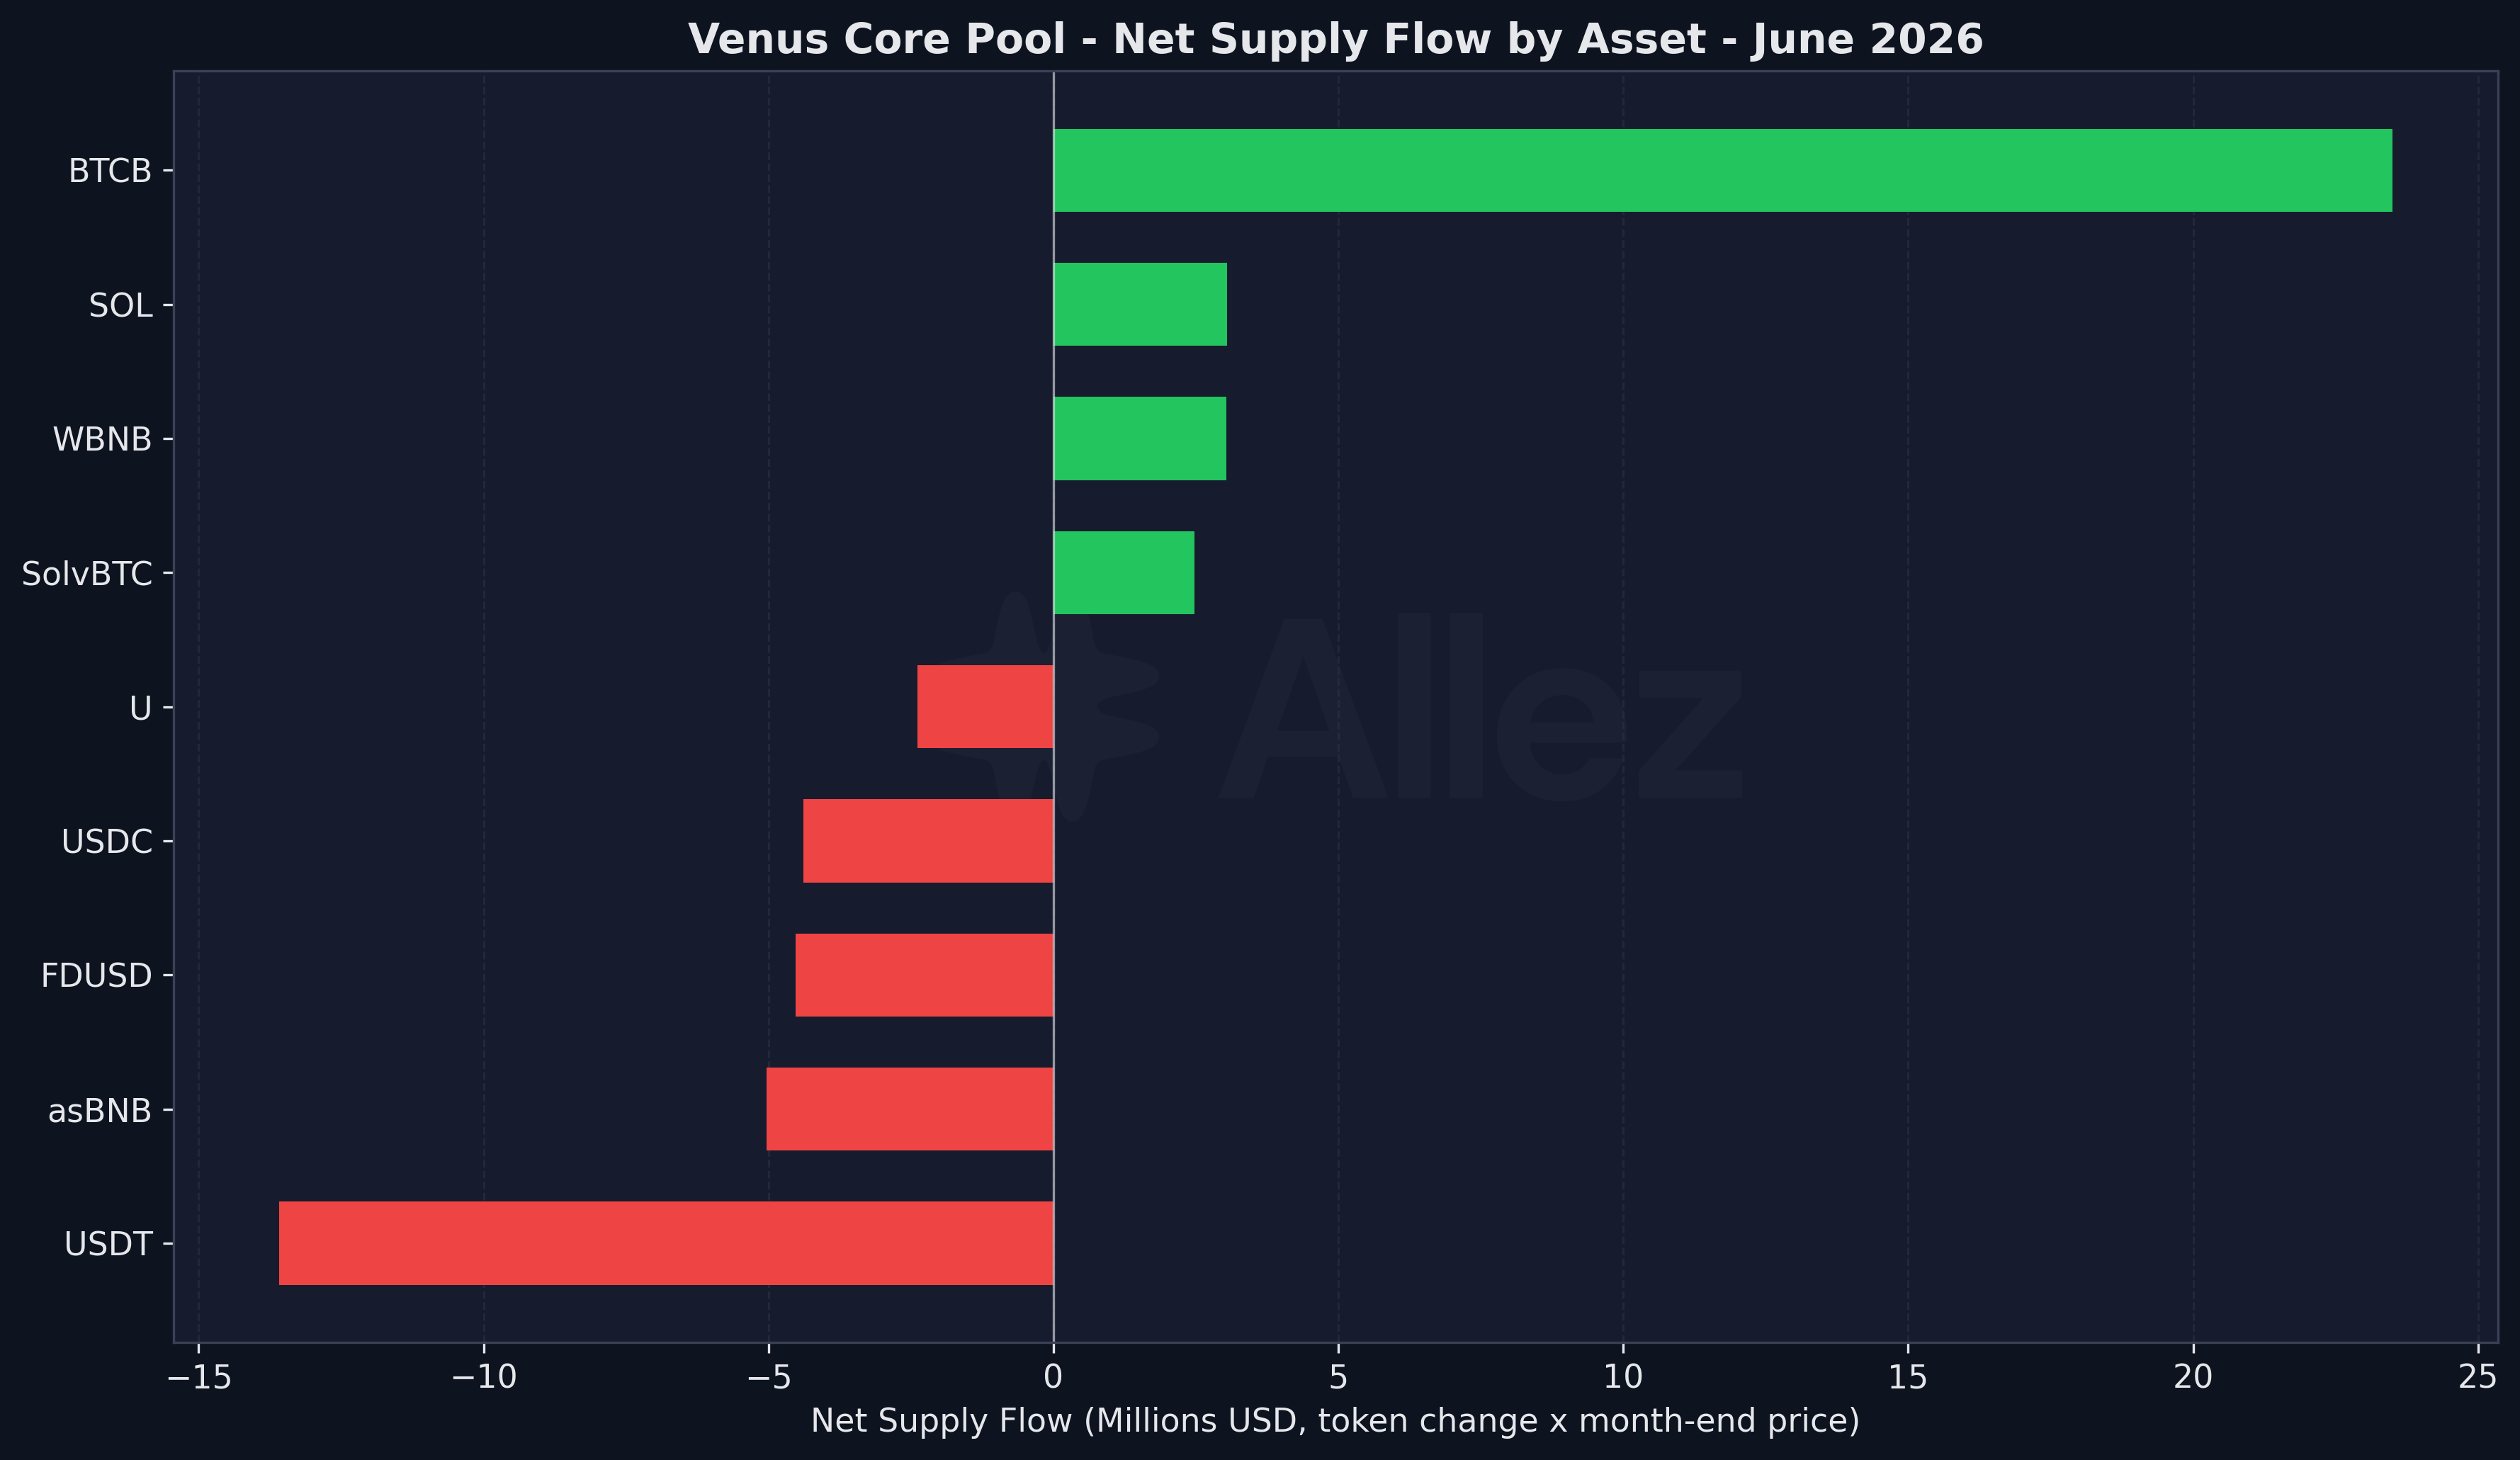
In token terms (price stripped out), the debt side mirrors supply: the E-mode loops deleveraged, taking risk off, while broad retail borrowing held roughly flat. The large books can absorb further selling without stress: even a further 30% correlated drop would put only about $27M of BNB-category and $18M of BTC-category collateral into liquidation, rising to about $31M of BNB and $66M of BTC at a 40% drop (Section 3). Both are modest for assets as liquid as BNB and BTC, which turn over far larger sums daily on-chain and on CEXs.
3. Risk & Liquidations
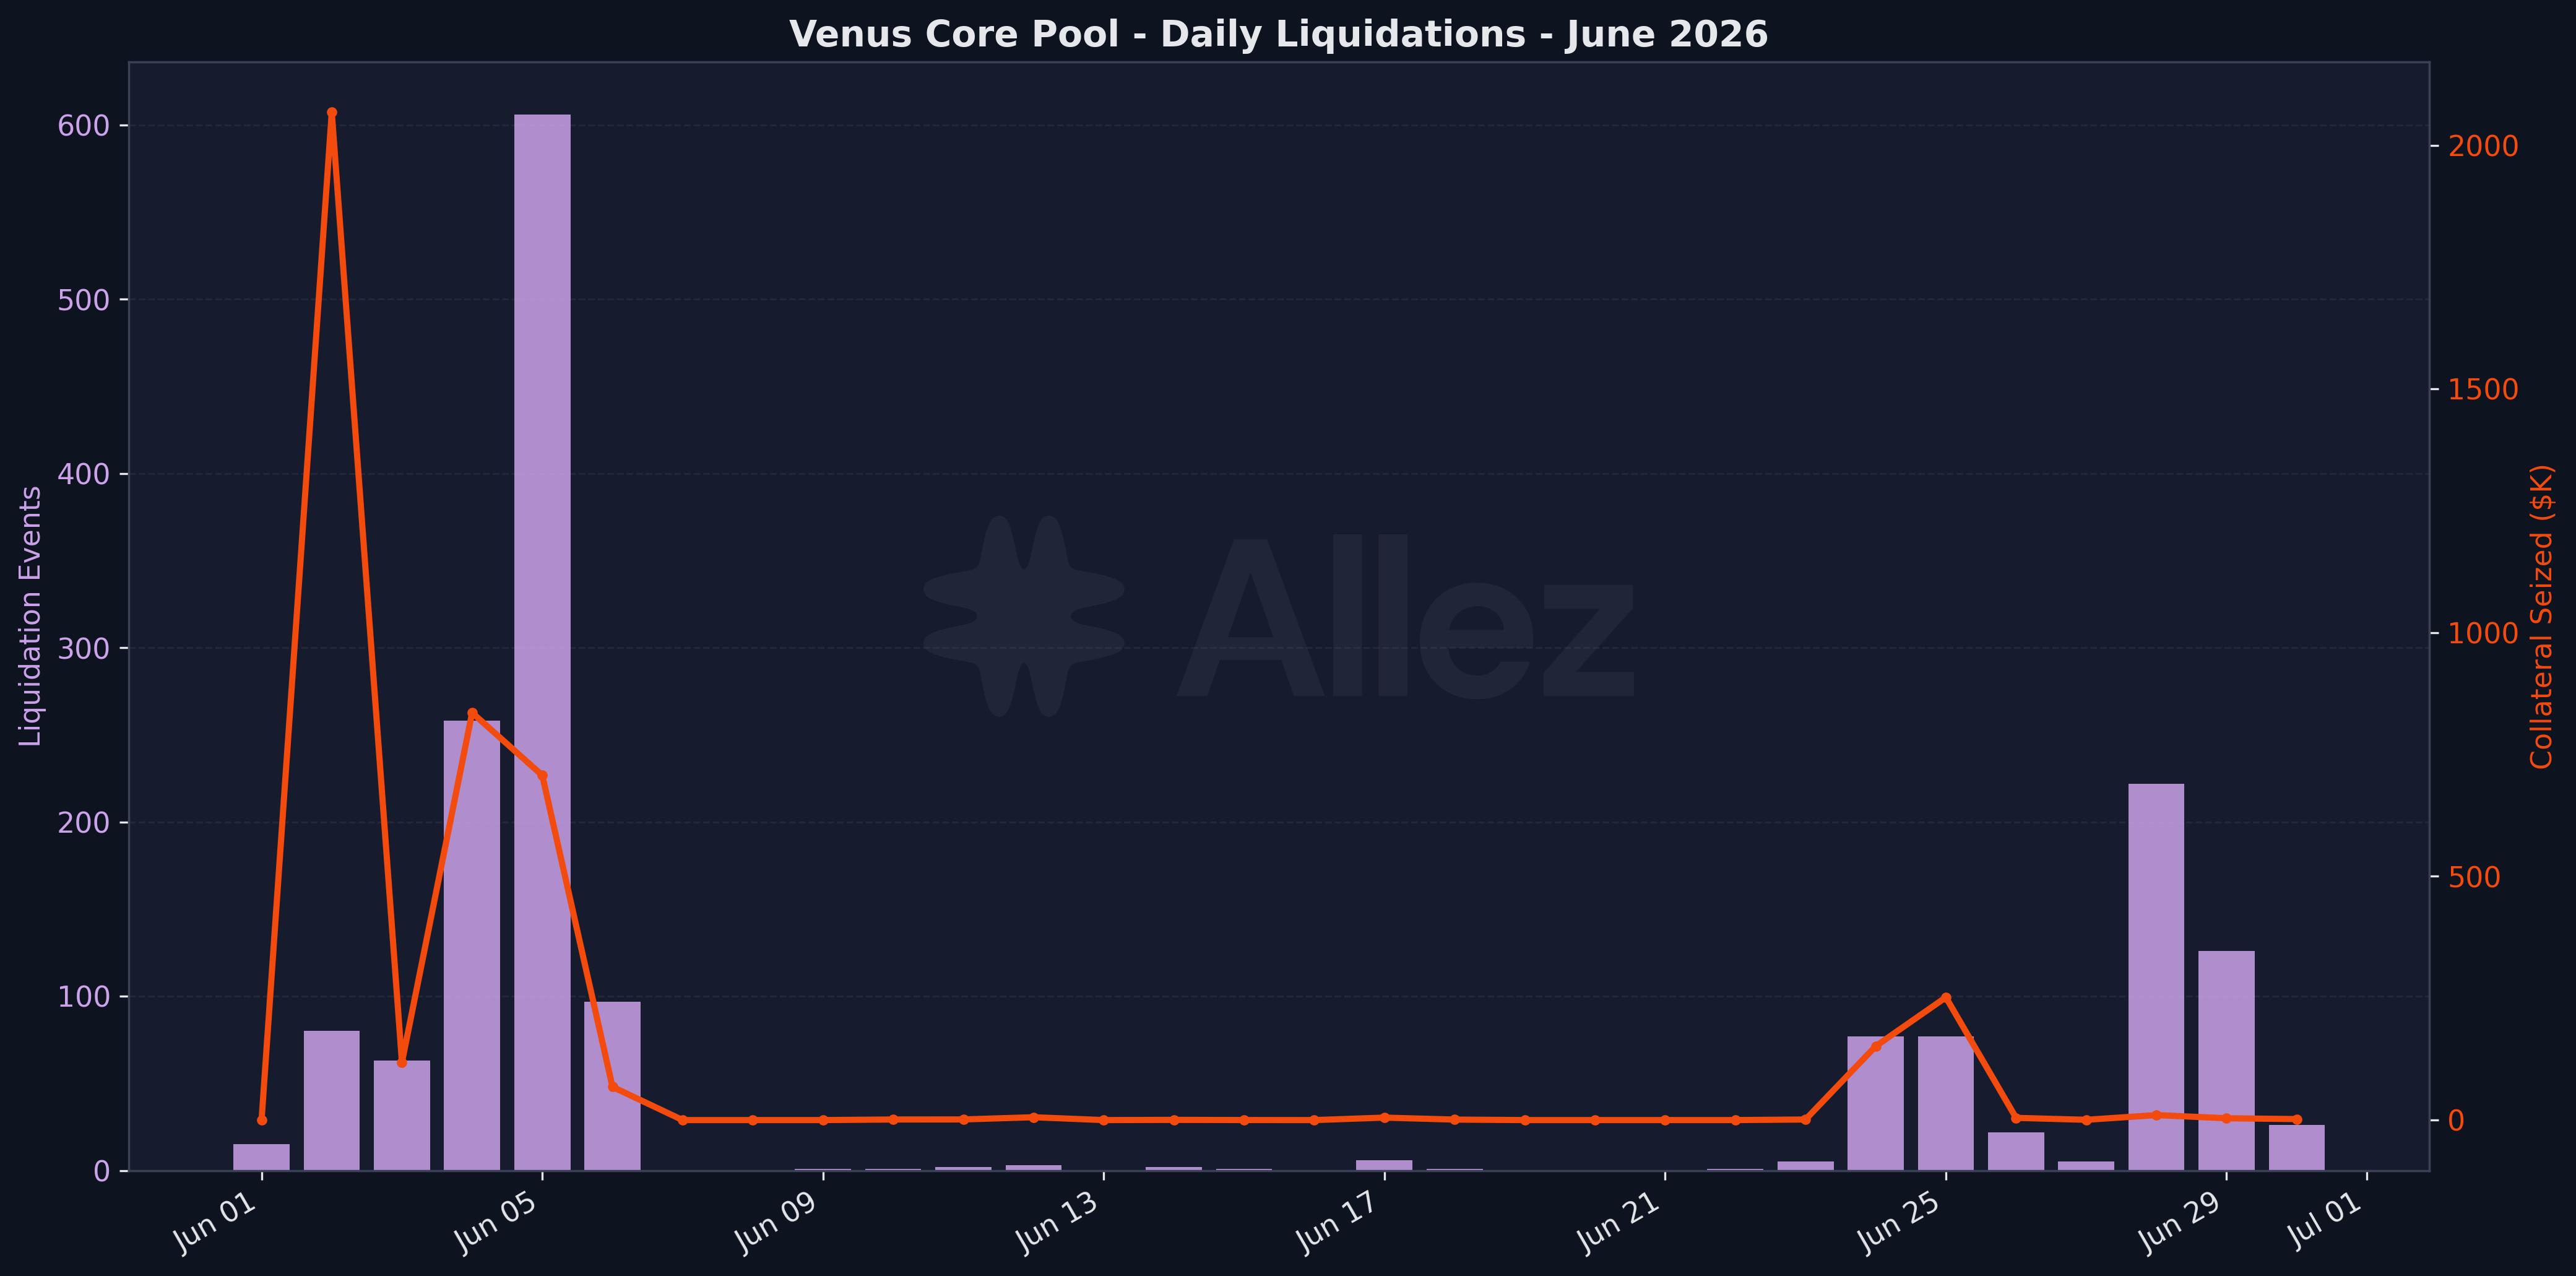
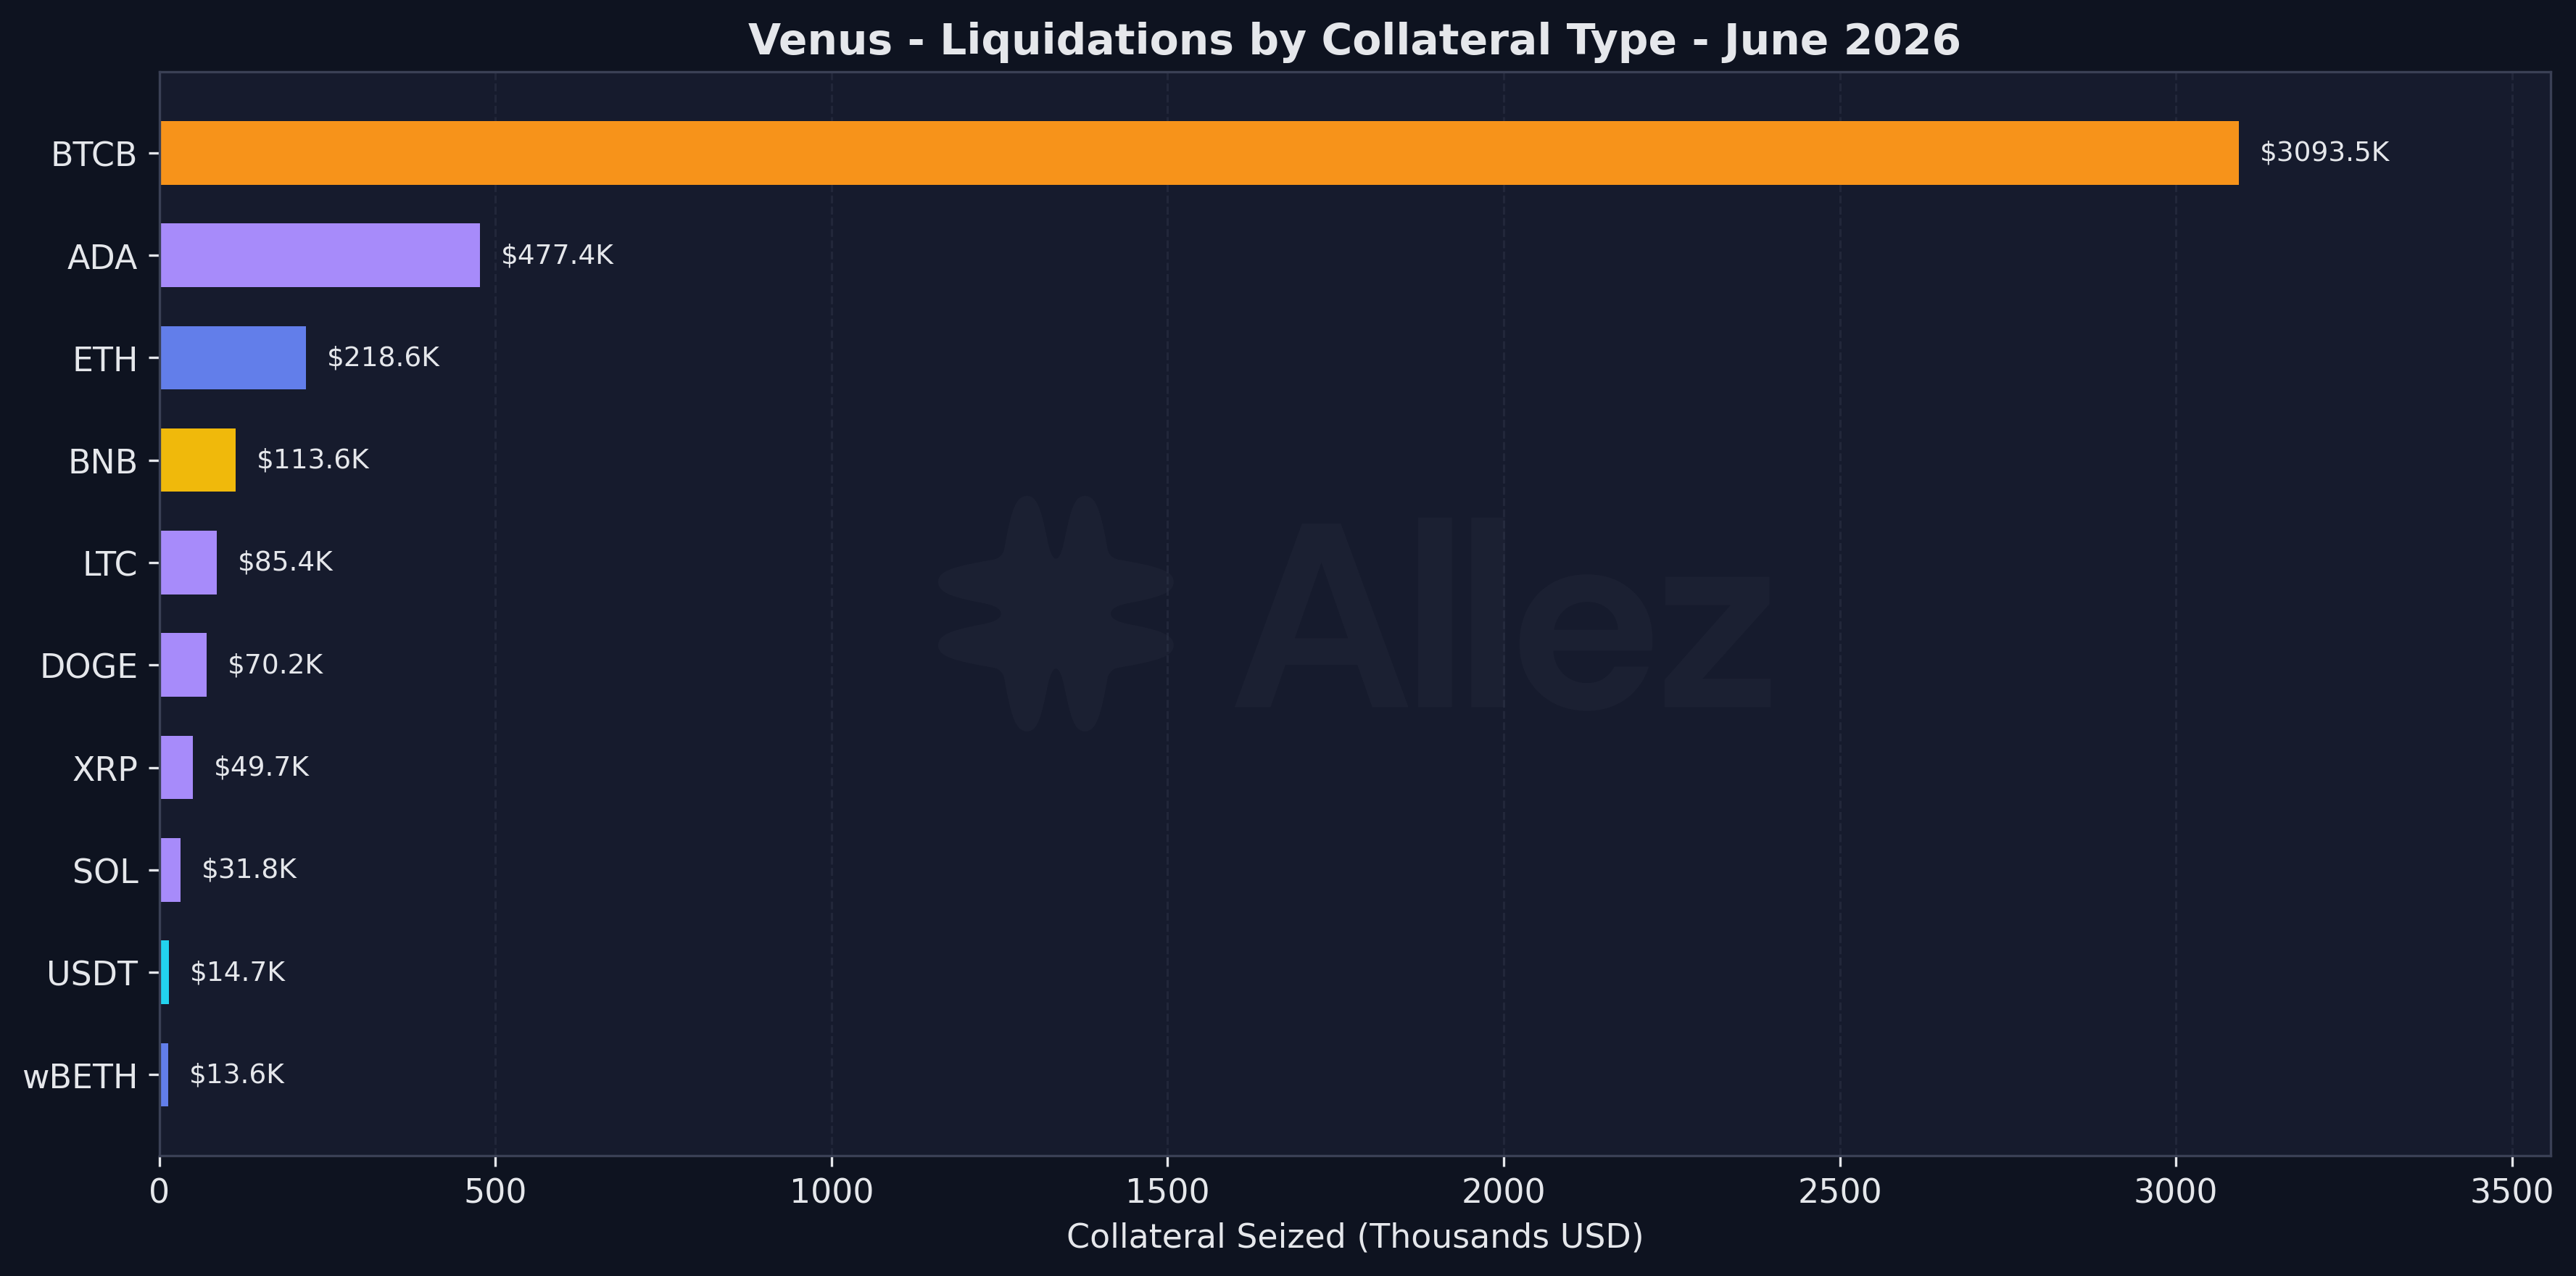
The 1,697 liquidation events seized $4.24M. June 2 was the peak day at $2.07M (nearly half the month), driven by the speed of the early-week slide: BNB fell from its $709.50 May close to a $642 intraday low on June 2 and kept dropping to an intraday $557 on June 5 (a $572 close), so the first five days did most of the damage. The rest was spread across the drawdown rather than concentrated in a single-position cascade, and the month’s absolute intraday low came later, $540.60 on June 25. BTCB collateral accounted for $3.09M (73%) of seized value, the dominant liquidation collateral for the month and consistent with a broad, BTC-led drawdown.
Liquidation summary:
| Metric | June Total |
|---|---|
| Total events | 1,697 |
| Collateral seized | $4.24M |
| Peak seized day | June 2 ($2.07M) |
| Peak event-count day | June 5 (606 events) |
Top collateral by seized value:
| Collateral | Seized | Events |
|---|---|---|
| BTCB | $3,093K | 243 |
| ADA | $477K | 220 |
| ETH | $219K | 228 |
| BNB | $114K | 279 |
| LTC | $85K | 51 |
Health factor distribution (June 30):
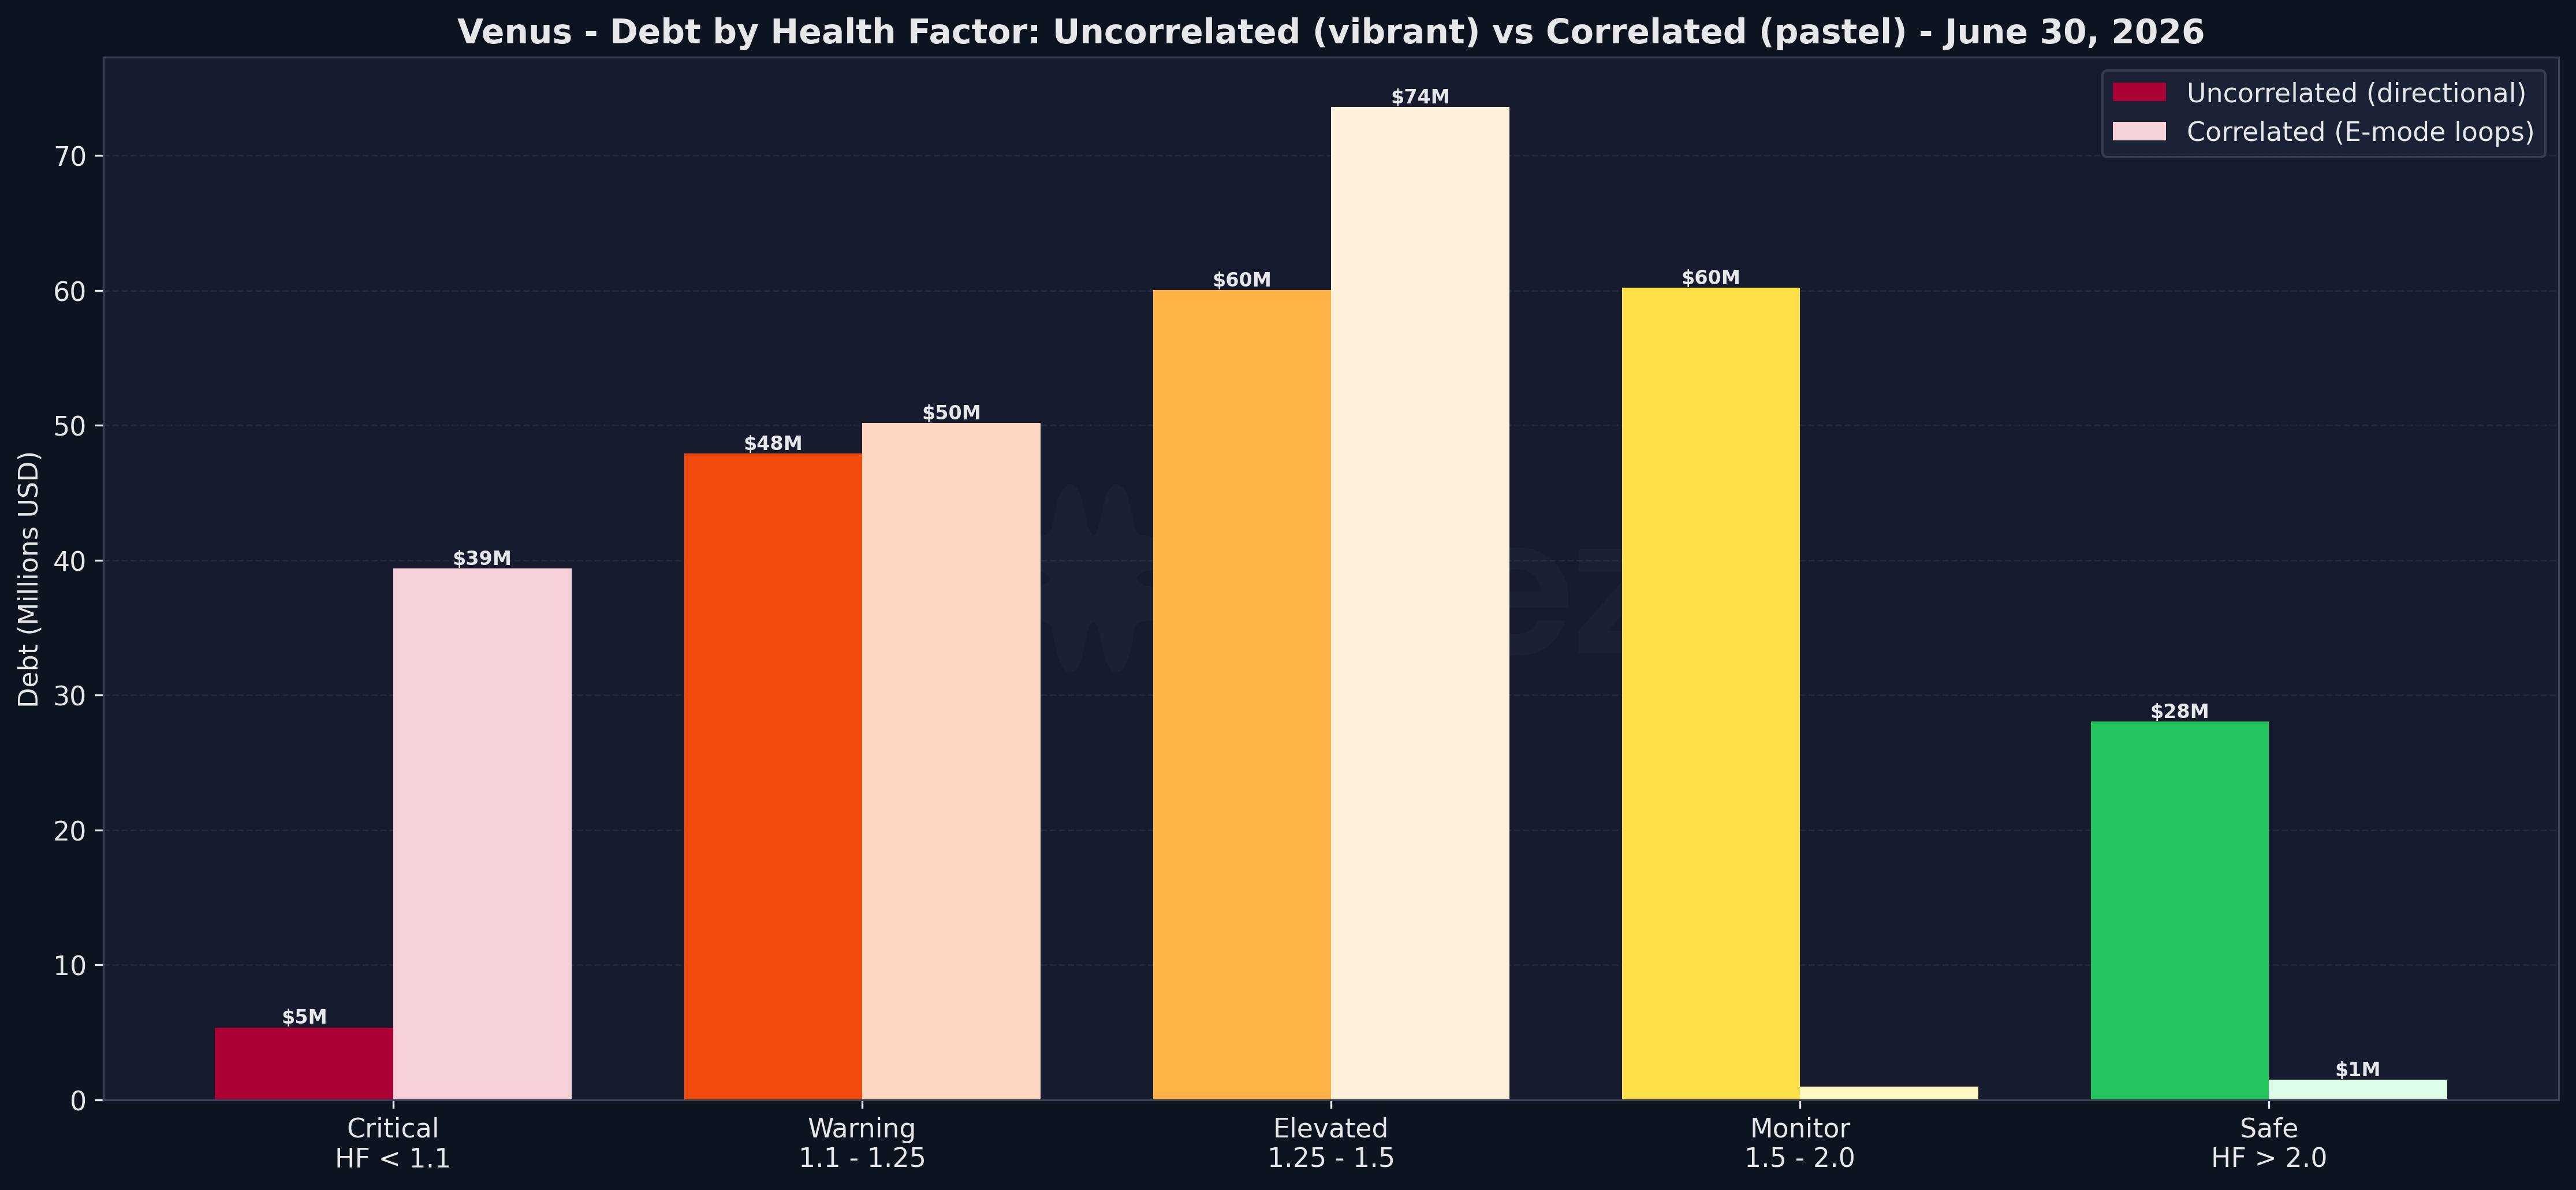
Correlated debt (E-mode loops such as SolvBTC against BTCB or asBNB against BNB) carries de-peg and redemption risk, not directional price risk: at a health factor near 1.1 the correlated leg would have to fall about 9% relative to its underlying to liquidate. Uncorrelated debt (BNB or stablecoins borrowed against unrelated collateral) carries the directional risk.
| Health Factor | Correlated Debt | MoM | Corr. Pos. | Uncorrelated Debt | MoM | Uncorr. Pos. |
|---|---|---|---|---|---|---|
| < 1.1 | $39.4M | +64.2% | 107 | $5.4M | -50.5% | 241 |
| 1.1 - 1.25 | $50.2M | -63.1% | 201 | $47.9M | -2.6% | 463 |
| 1.25 - 1.5 | $73.6M | +51.5% | 148 | $60.0M | +13.7% | 653 |
| 1.5 - 2.0 | $1.0M | -65.2% | 40 | $60.2M | -27.7% | 676 |
| > 2.0 | $1.5M | +113.7% | 85 | $28.0M | -14.6% | 914 |
The riskier share of the book that bears on solvency improved: uncorrelated debt below a 1.1 health factor halved to $5.4M over the drawdown. The correlated E-mode book shifted tighter, with $39.4M now below 1.1, but both legs track the same asset, so this is structural leverage, not directional exposure.
Stablecoin debt by collateral:
| Collateral | Stablecoin Debt | Within 10% of Liquidation |
|---|---|---|
| BTCB | $65.1M | $4.07M |
| SolvBTC | $38.4M | $0.0M |
| BNB | $28.1M | $1.0M |
| ETH | $7.4M | $0.3M |
| USDT | $7.9M | $5.2M |
| wBETH | $5.2M | $0.0M |
Stablecoin debt against volatile collateral is conservative: $5.7M across all volatile collateral sits within 10% of liquidation, of which the three largest positions below (BTCB, BNB, ETH) are $5.4M and the remainder sits in smaller positions. The most exposed is BTCB, where $4.07M of the $65.1M it backs is near threshold, making it the debt most sensitive to a further BTC decline. The USDT row is stablecoin-collateralized, so it carries de-peg rather than directional risk and is excluded from the $5.7M.
Forward stress test: June was one real drawdown. To size what a deeper one would do, we reprice every Core Pool account under a further uniform price shock to volatile collateral and debt (stablecoins held at $1), then recompute health against each asset’s liquidation threshold. Because correlated E-mode loops carry the shock on both legs, they stay roughly neutral, so the accounts that break are the directional ones.
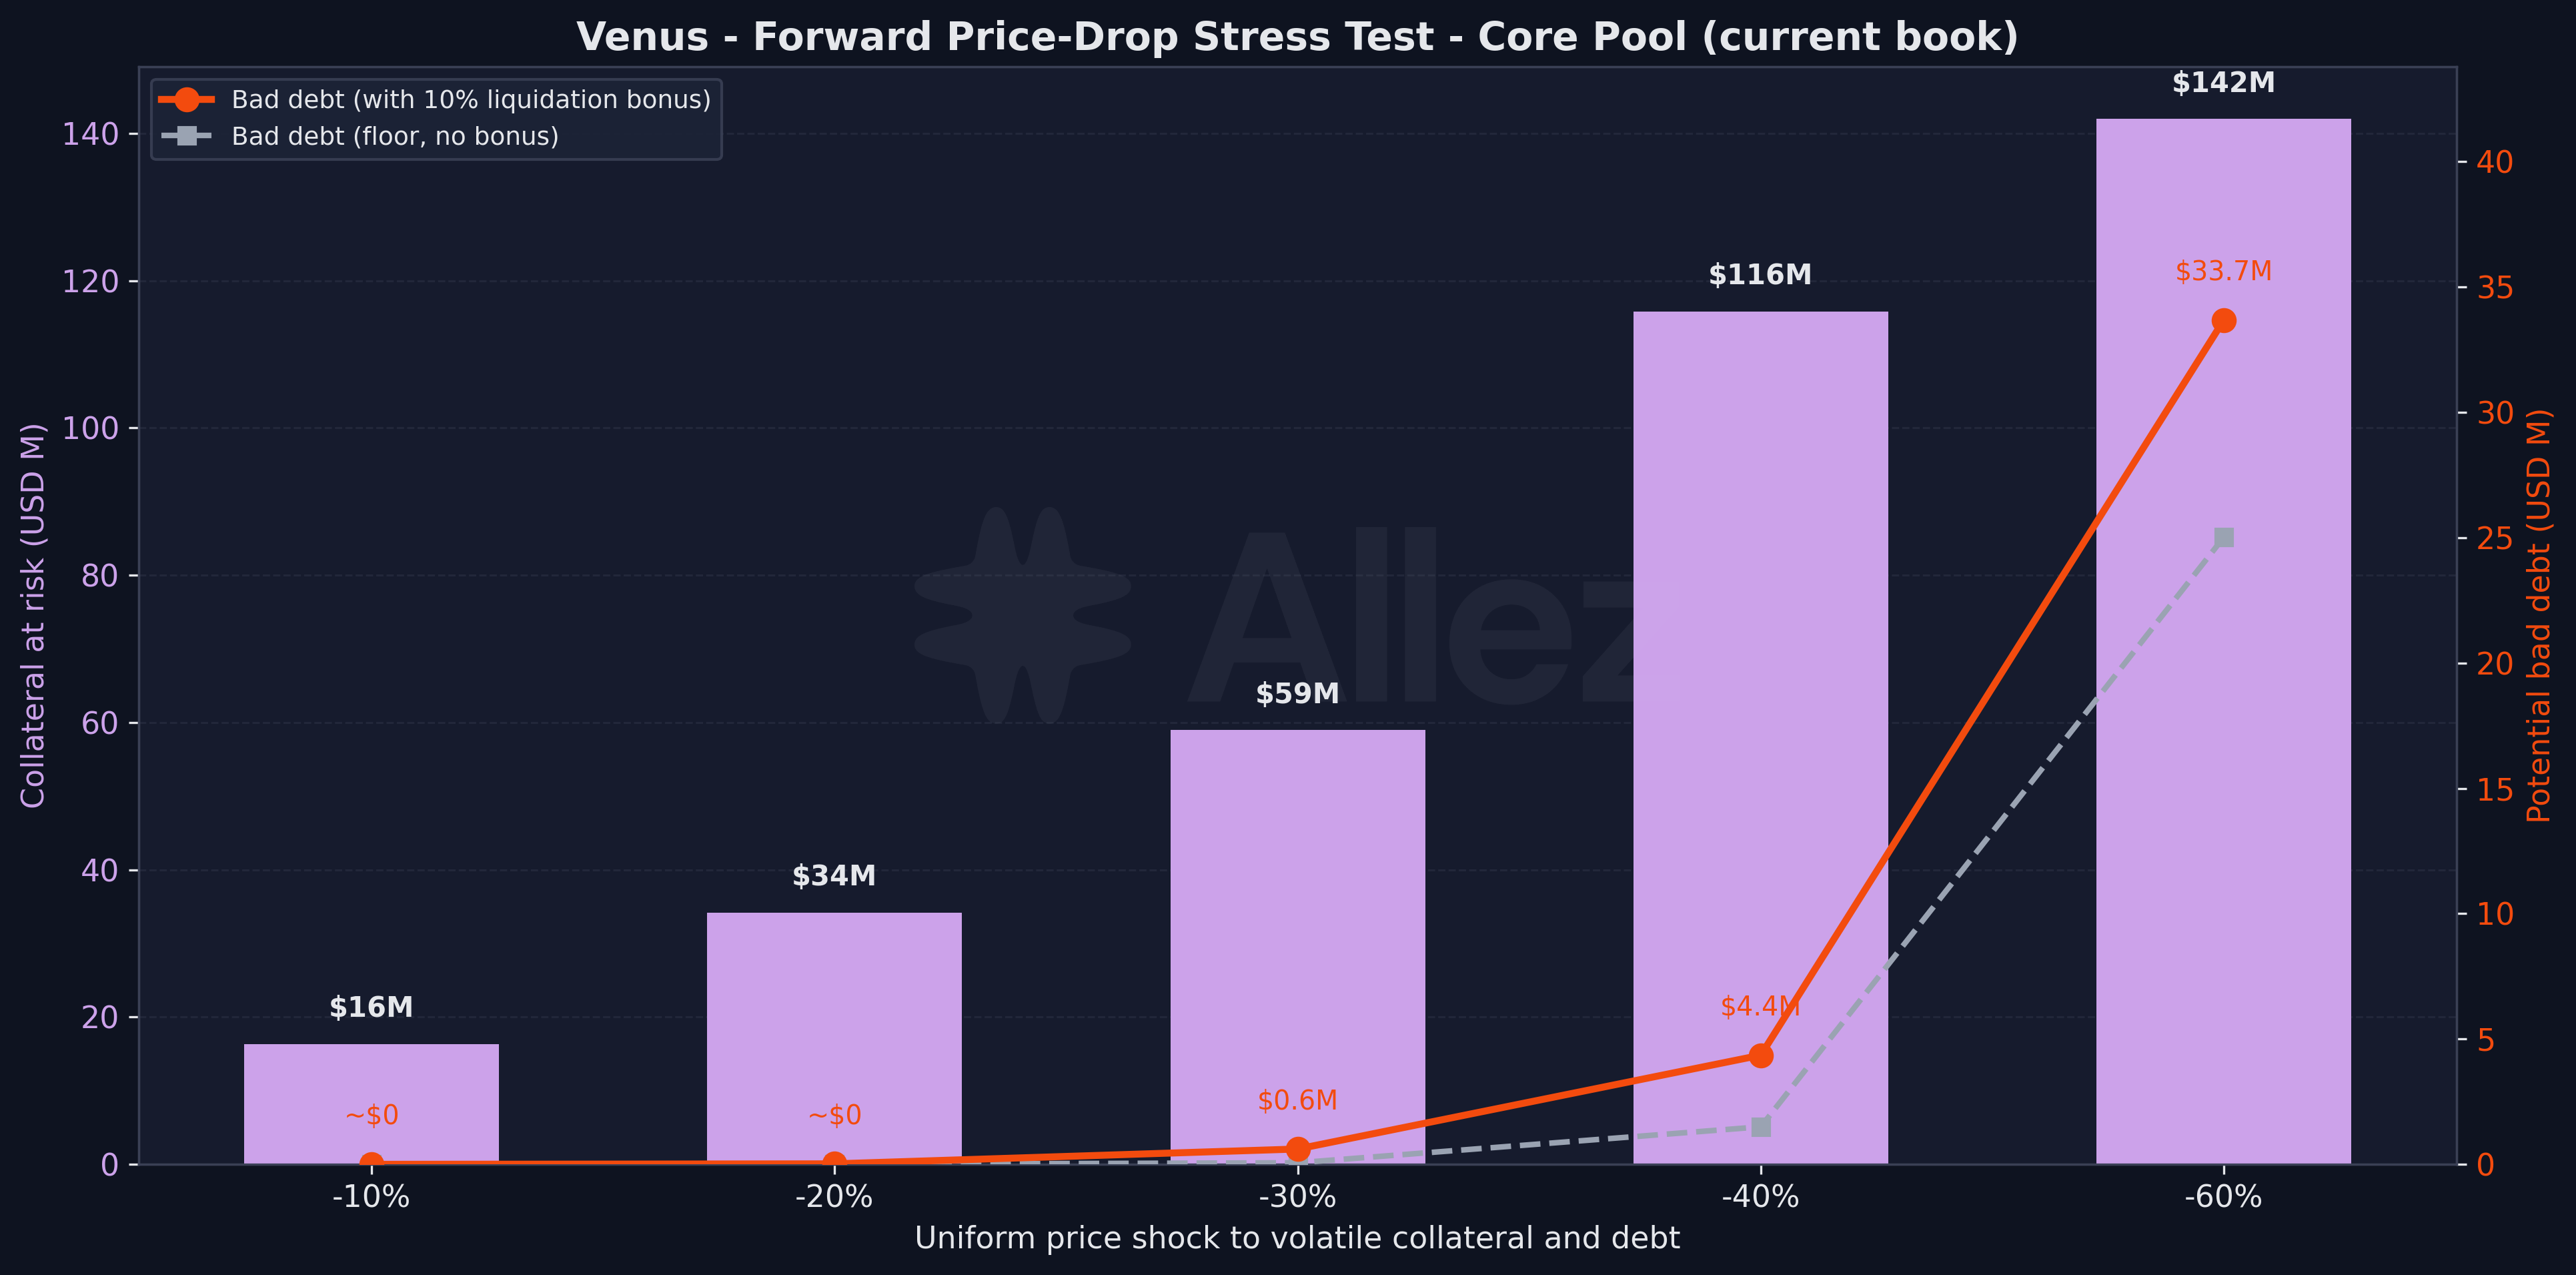
| Price shock | Accounts liquidated | Collateral at risk | Bad debt (floor) | Bad debt (+10% bonus) |
|---|---|---|---|---|
| Current book | 4,845 | $16.5M | ~$0 | ~$0 |
| -10% | 5,017 | $16.3M | ~$0 | ~$0 |
| -20% | 5,831 | $34.2M | ~$0 | $0.02M |
| -30% | 6,621 | $59.0M | $0.06M | $0.6M |
| -40% | 7,331 | $115.8M | $1.5M | $4.4M |
| -60% | 8,775 | $141.9M | $25.0M | $33.7M |
The book stays solvent through a severe additional decline. The current book already carries $16.5M in accounts at or below their liquidation threshold, but that tail is dust: 4,845 accounts averaging ~$3.4K each, with no bad debt, that liquidators clear in the normal course. A further 30% drop, on top of the 23% BNB fall already absorbed, still produces negligible bad debt ($0.06M on a no-bonus basis, $0.6M once the 10% liquidation bonus is applied), because liquidations clear against collateral worth more than the debt. Bad debt only becomes material at a 40% further crash ($1.5M to $4.4M, roughly 0.1% to 0.3% of the $1.33B book) and climbs to $25M-$34M at 60%, where the deepest accounts’ collateral finally falls below their debt. We show both a no-bonus floor and a bonus-adjusted figure: the floor is a lower bound, and the bonus-adjusted column is the more realistic estimate because Venus pays liquidators a ~10% incentive out of the same collateral.
Methodology: Uniform shock applied to all non-stablecoin collateral and debt simultaneously (a correlated market-wide crash). An account is counted liquidatable when collateral value times its liquidation threshold falls below debt. The bad-debt floor is debt in excess of the full shocked market value of remaining collateral; the bonus-adjusted figure nets out a 10% liquidation incentive. This is a point-in-time snapshot of the current Core Pool book, not a path-dependent cascade simulation, and it does not model liquidator capacity or slippage. By construction the shock holds correlated E-mode loops roughly neutral. Their binding risk: a ~9% de-peg or basis move between the two legs of those loops, could liquidate up to the $39.4M of correlated debt now below a 1.1 health factor. That is a separate scenario from the directional crash modeled here as RWA risk profile has little correlation to digital asset volatility.
Borrower concentration eased through the month: the top-five share fell from 35.8% to 31.9% and the top-three from 28.6% to 24.5%. Most run correlated or E-mode structures, with structurally tight health factors. The single largest is about $42M of BNB borrowed against a diversified base led by asBNB ($35.7M, itself BNB-correlated) and BTCB, now at a 1.27 health factor after partially deleveraging (BTCB-backed debt down ~21% in token terms) and part markdown of BNB-denominated debt.
4. Collateral Structure & Revenue
Top collateral/borrow pairs:
| Collateral | Borrowed | Debt | May Debt | MoM | Users |
|---|---|---|---|---|---|
| BTCB | USDT | $48.1M | $48.0M | 0% | 2,177 |
| SolvBTC | BTCB | $34.9M | $51.3M | -32% | 21 |
| SolvBTC | USDT | $33.2M | $31.4M | +6% | 37 |
| xSolvBTC | BTCB | $29.0M | $36.5M | -21% | 12 |
| asBNB | BNB | $28.8M | $40.9M | -30% | 37 |
| BTCB | BTCB | $26.7M | $23.6M | +13% | 616 |
| BTCB | BNB | $24.8M | $32.0M | -22% | 1,879 |
The concentrated E-mode loops (SolvBTC/BTCB, xSolvBTC/BTCB, asBNB/BNB) each hold fewer than 40 users and mostly shrank as users reduced leverage. Meanwhile the broad retail pairs (thousands borrowing USDT or BNB against BTCB) held flat and carry the directional risk that drove the month’s liquidations.
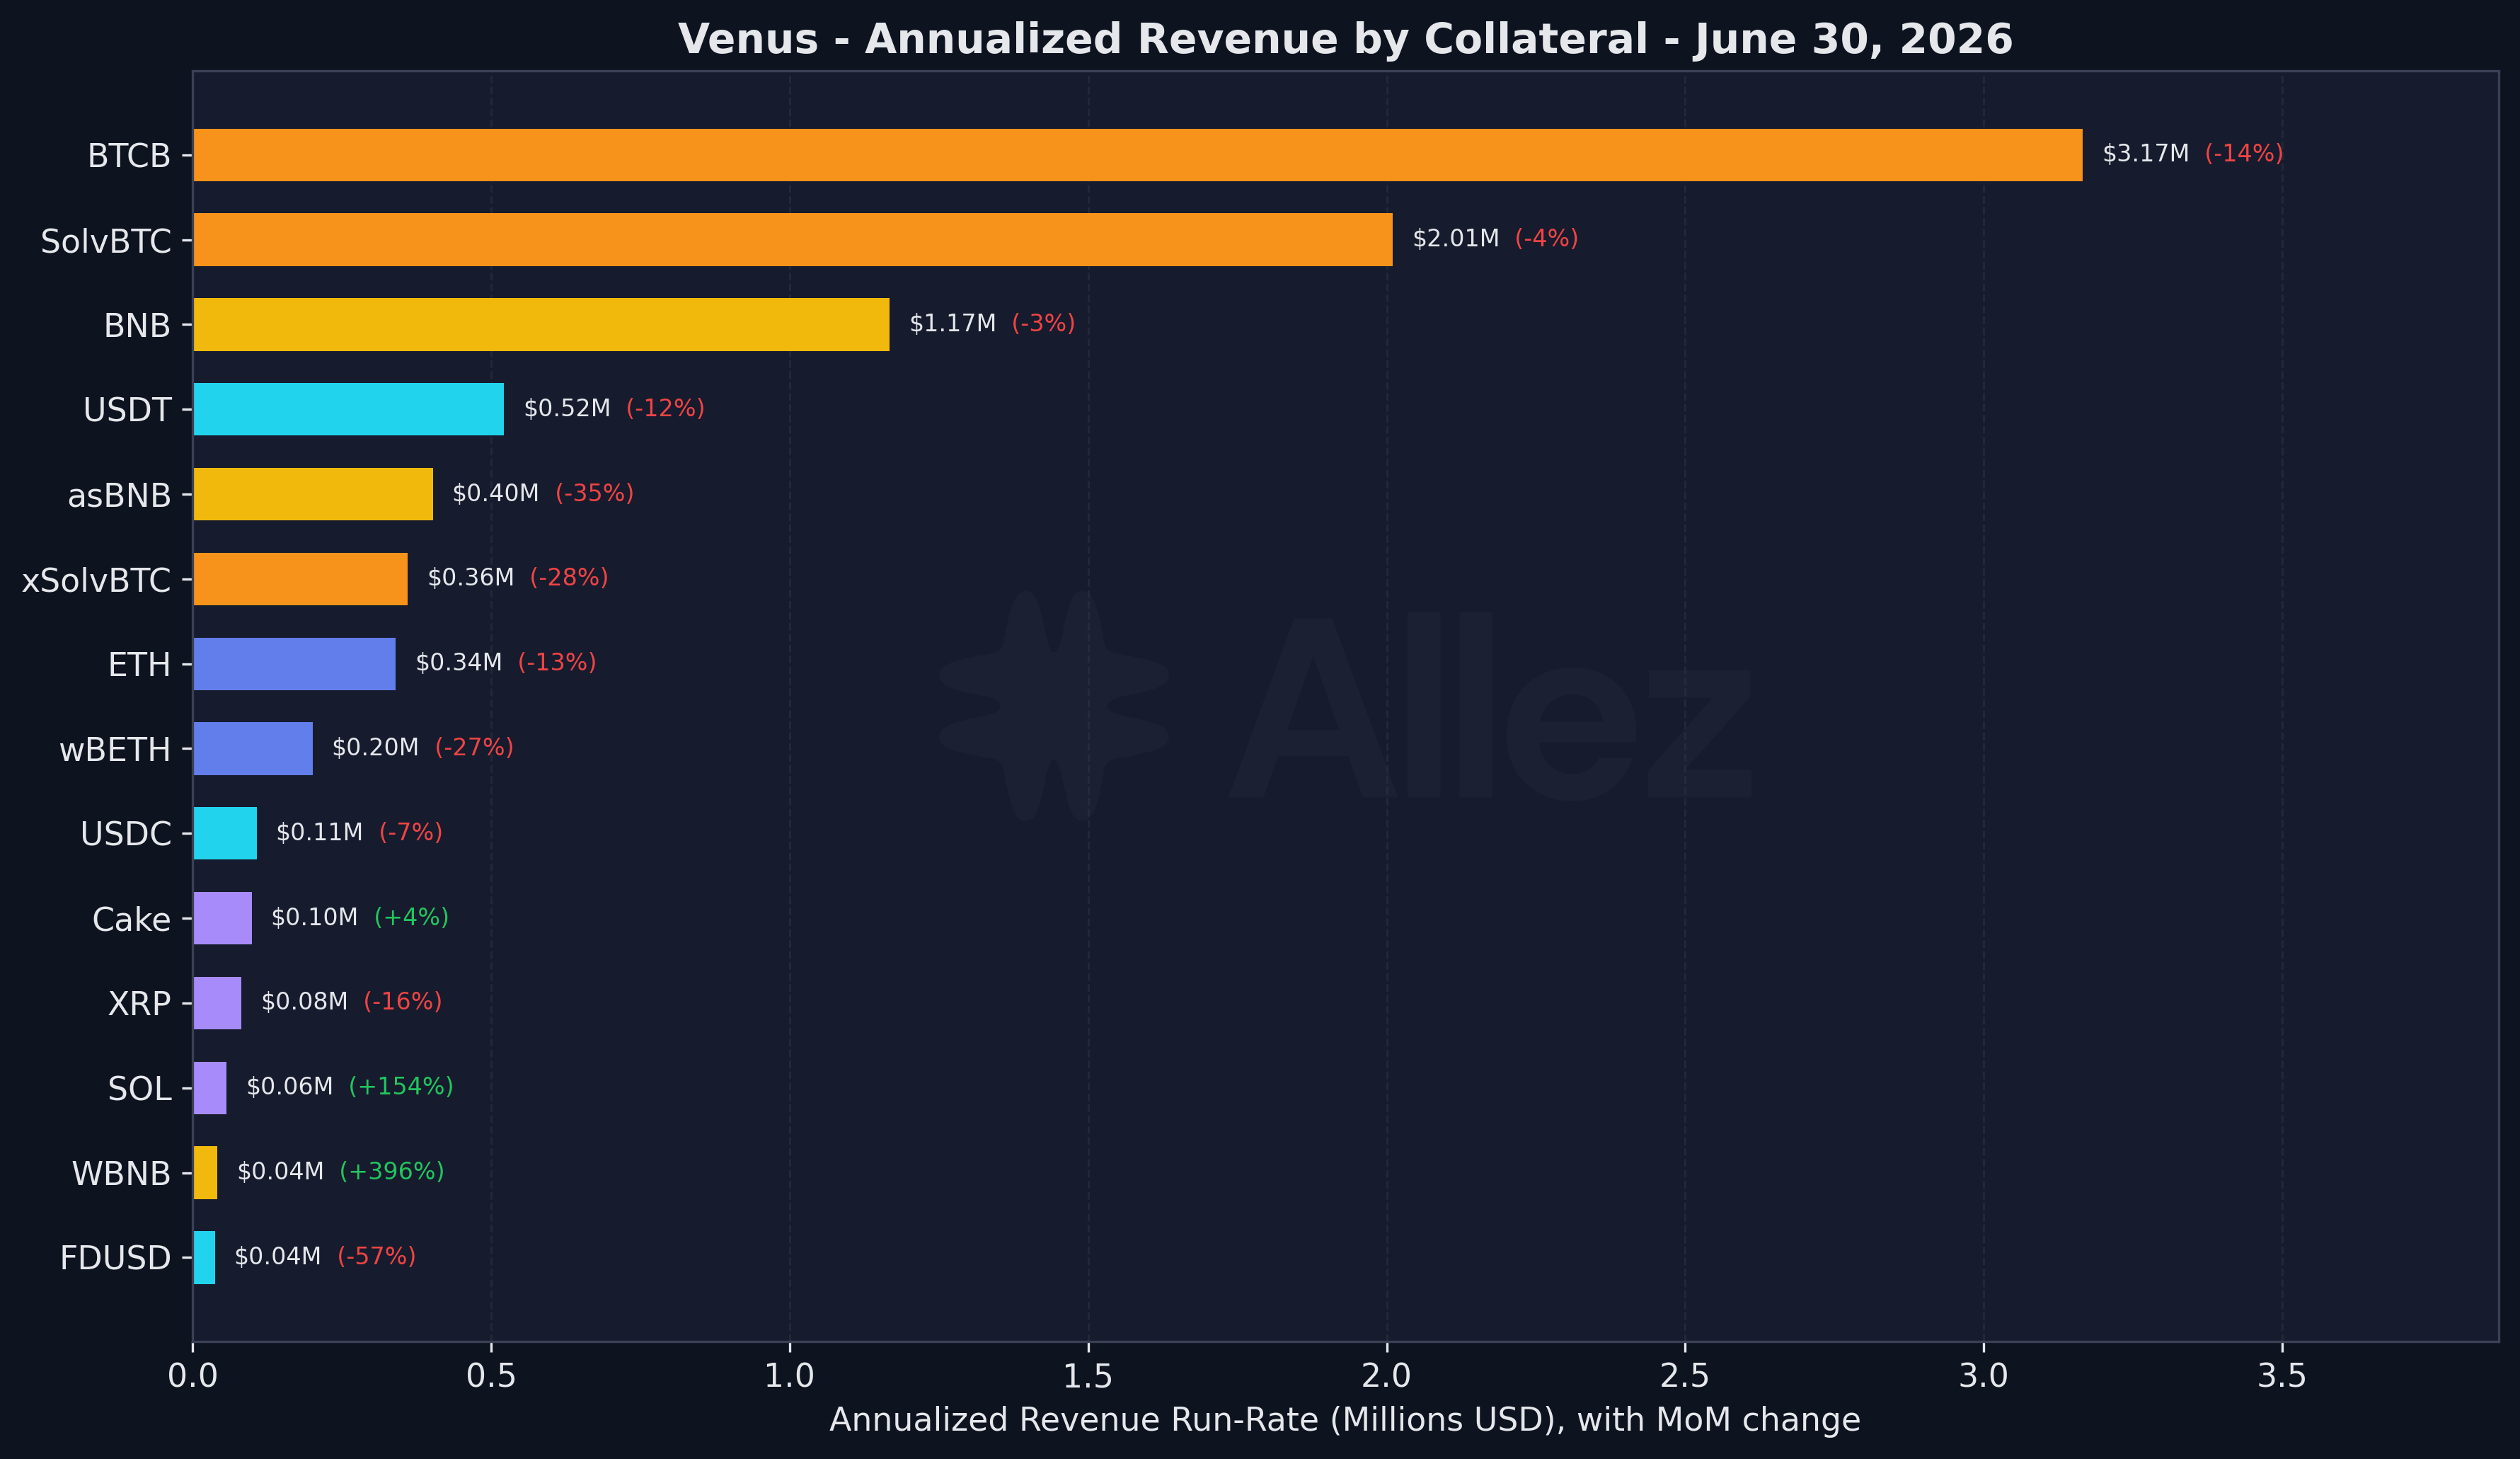
The annualized revenue run-rate is $8.6M, down about 13% from May on a like-for-like basis as June’s deleveraging shrank the interest-bearing book, with the sharpest drops in the E-mode liquid-staking loops (asBNB -35%, xSolvBTC -28%, wBETH -27%). About 64% of the run-rate still comes from the BTC complex (BTCB, SolvBTC, xSolvBTC). In realized terms, borrowers paid $776K of gross interest during June, of which the protocol retained $133K at a 17.1% blended reserve factor, in line with May ($891K gross, $142K protocol).
5. Utilization
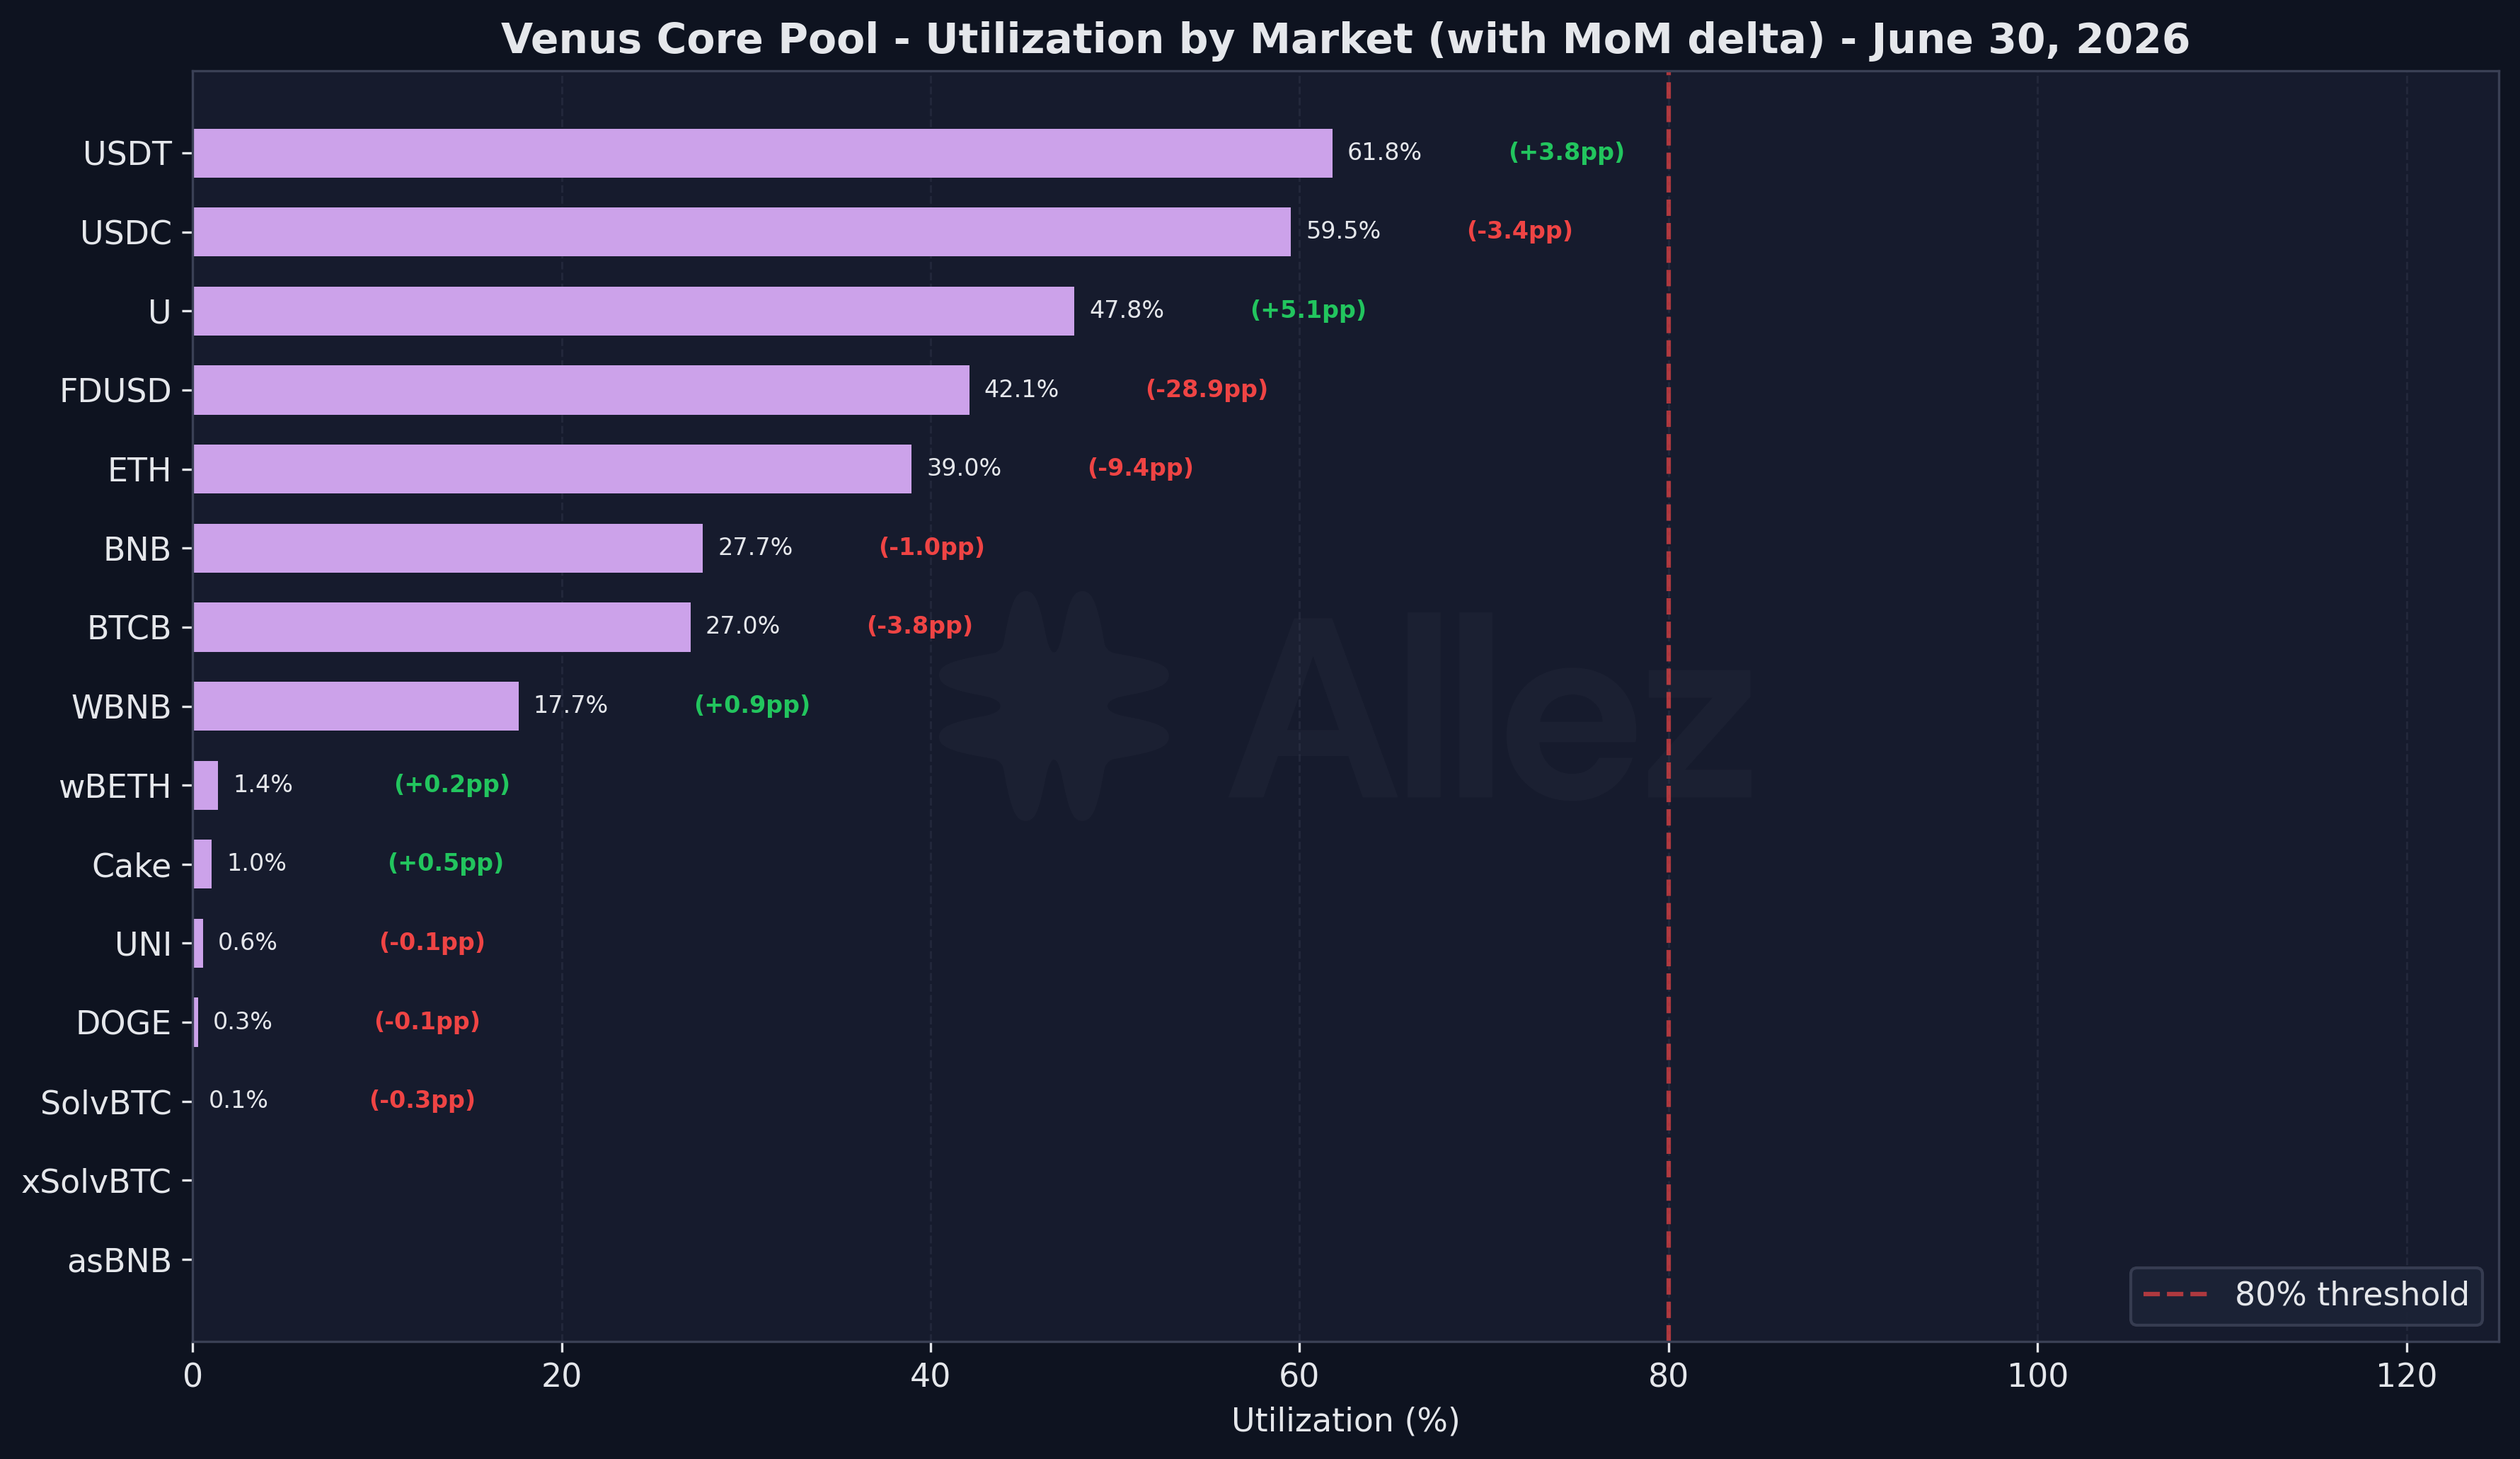
Utilization is moderate, with no market near stress. The highest are USDT at 61.8% and USDC at 59.5%, both well below the 80% threshold, and the large collateral markets sit low (BTCB 27.0%, BNB 27.7%). ETH utilization continued to decline (-9.4pp to 39.0%) from its April level, the same trend as last month. The one sharp move was FDUSD, down 28.9pp to 42.1%: borrowers repaid about 60% of the debt (roughly $6M) against a 32% supply withdrawal, so debt fell faster than deposits, leaving the market further from its cap than in May. Everything else moved within a few points, with utilization stable month-over-month.
6. Conclusions & Forward Look
The Core Pool came through June with a lower risk profile and better calibration. A 23% BNB drop worked through the book as a controlled deleveraging: the contraction was price-led, leverage came off the E-mode loops, and the directional book below a 1.1 health factor halved to $5.4M. The month’s structural changes sit alongside that resilience: the oracle infrastructure evolved to Atlas, and Venus listed its first tokenized equities at conservative parameters.
Things to watch in July:
- Oracle. The Atlas infra is new, now prices the Core Pool. Executed after June’s drawdown, its first real stress test lies ahead. Watch feeds and potential divergence between Atlas, Chainlink OEV and RedStone anchors, and assess the first full month produces no oracle-driven liquidations.
- bStocks adoption. Watch whether borrow demand develops against the tight supply caps, and whether PancakeSwap X liquidity is deep enough to support liquidations if it does.
- BTCB. It was the largest real inflow and is also the collateral with the most stablecoin debt near liquidation ($4.07M within 10%), so it is the asset most sensitive to a further BTC leg down.
- Borrower concentration. The top three borrowers hold 24.5% of protocol debt; the largest is a ~$42M BNB borrow at a 1.27 health factor that would tighten again if BNB rebounds.
If there’s something specific you’d like us to cover next month, or any feedback on what’s here, let us know in the comments below.
Appendix: Asset Category Classification
| Category | Assets | Supply | Debt |
|---|---|---|---|
| BTC | BTCB, SolvBTC, xSolvBTC | $526M | $91M |
| BNB | BNB, WBNB, asBNB, slisBNB, PT-clisBNB | $432M | $96M |
| Stablecoins | USDT, USDC, FDUSD, DAI, U, USD1, TUSD, sUSDe, USDe, lisUSD | $281M | $165M |
| ETH | ETH, wBETH, BETH | $46M | $12M |
| Altcoins | Cake, XRP, ADA, LTC, LINK, DOGE, TSLAB, NVDAB, SPCXB, others | $48M | $2M |
Correlated positions hold collateral and debt in the same price category (for example SolvBTC against BTCB, or asBNB against BNB) and carry low directional risk. Uncorrelated positions span categories (for example BTCB against USDT) and carry true directional exposure.
Scope: Venus Core Pool on BNB Chain only. Isolated pools and non-BNB deployments are out of scope for this report.
This report represents independent risk analysis by Allez Labs for the Venus community.