Introducing the Venus Monthly Report
Today we’re publishing the first edition of the Venus Monthly Report. Our goal is to give the community a clearer view of the protocol’s growth and the state of risk across its markets, in one place each month.
This is a new format, so we want it to be useful to you. If there’s something specific you’d like us to cover next month, or any feedback on what’s here, let us know in the comments below.
Summary
Total supply across Venus BNB Core edged down from $1.66B to $1.62B (-2.1%) while debt also declined from $471.4M to $449M (-5%). The dollar declines reflect outflows and price drops that together outweighed the BNB price increase. ETH debt halved as large April positions unwound. Within governance, Venus added two new safeguards, a tighten-only EBrake Executor and the Oracle Dynamic Protection Mode, alongside the continued wind-down of a few deprecated markets. Position health distribution remained robust: most low-health-factor debt is correlated E-mode leverage, leaving only $10.9M of directional debt below a 1.1 health factor.
1. Market Context & BNB Price
KPI Summary
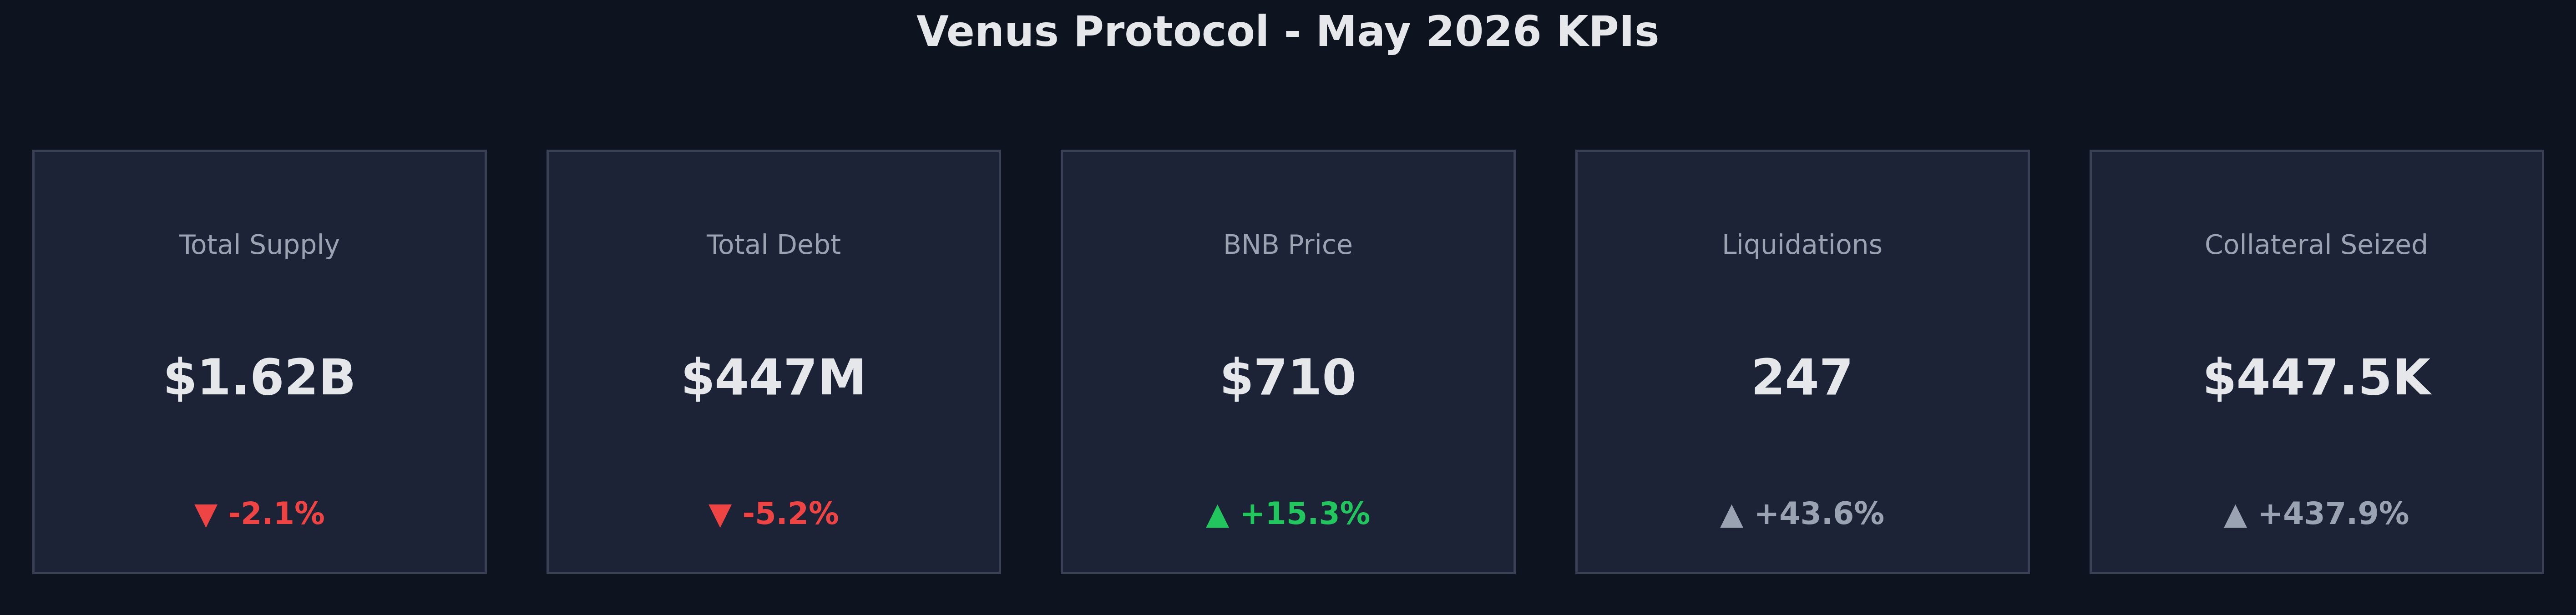
Venus Core Pool closed May 31 with:
- Total Supply: $1.623B (-2.1%)
- Total Debt: $449M (-5%)
- BNB Price: $709.50 (+15.3%)
- Liquidations: 247 events (+43.6%)
- Collateral Seized: $447.5K (+437.9%)
Most of BNB’s 15.3% gain arrived over the final three days (May 29 to 31). BNB price movements matter for top-line metrics because BNB-correlated assets (BNB, WBNB, asBNB, slisBNB) total $567M in deposits, the second-largest grouping behind BTC. BTC and ETH prices fell over the month, and with BTCB the single most borrowed asset and second most supplied, that drop weighed on headline supply and debt. Stablecoin supply tends to follow prices down, and USDC contracted 31.7% this month.
Venus Ecosystem Updates:
- SXP market deprecation executed. (forum notice)
- DAI off-boarded as collateral as part of the May risk-parameter update. Existing positions are unaffected. (proposal)
- Wk20 VIP (mid-May) bundled the TUSD and FIL wind-down, activation of the tighten-only EBrake Executor (audited by CertiK and Hashdit), and a marketing-funding transfer. (VIP)
- Oracle Dynamic Protection Mode announced (mid-May) to harden the borrow path against price-manipulation and flash-volatility risk. (proposal)
- Venus Prime redesign put to a Snapshot vote (May 26). (post)
- Venus Trade launched on BNB Chain (teased early May). (thread)
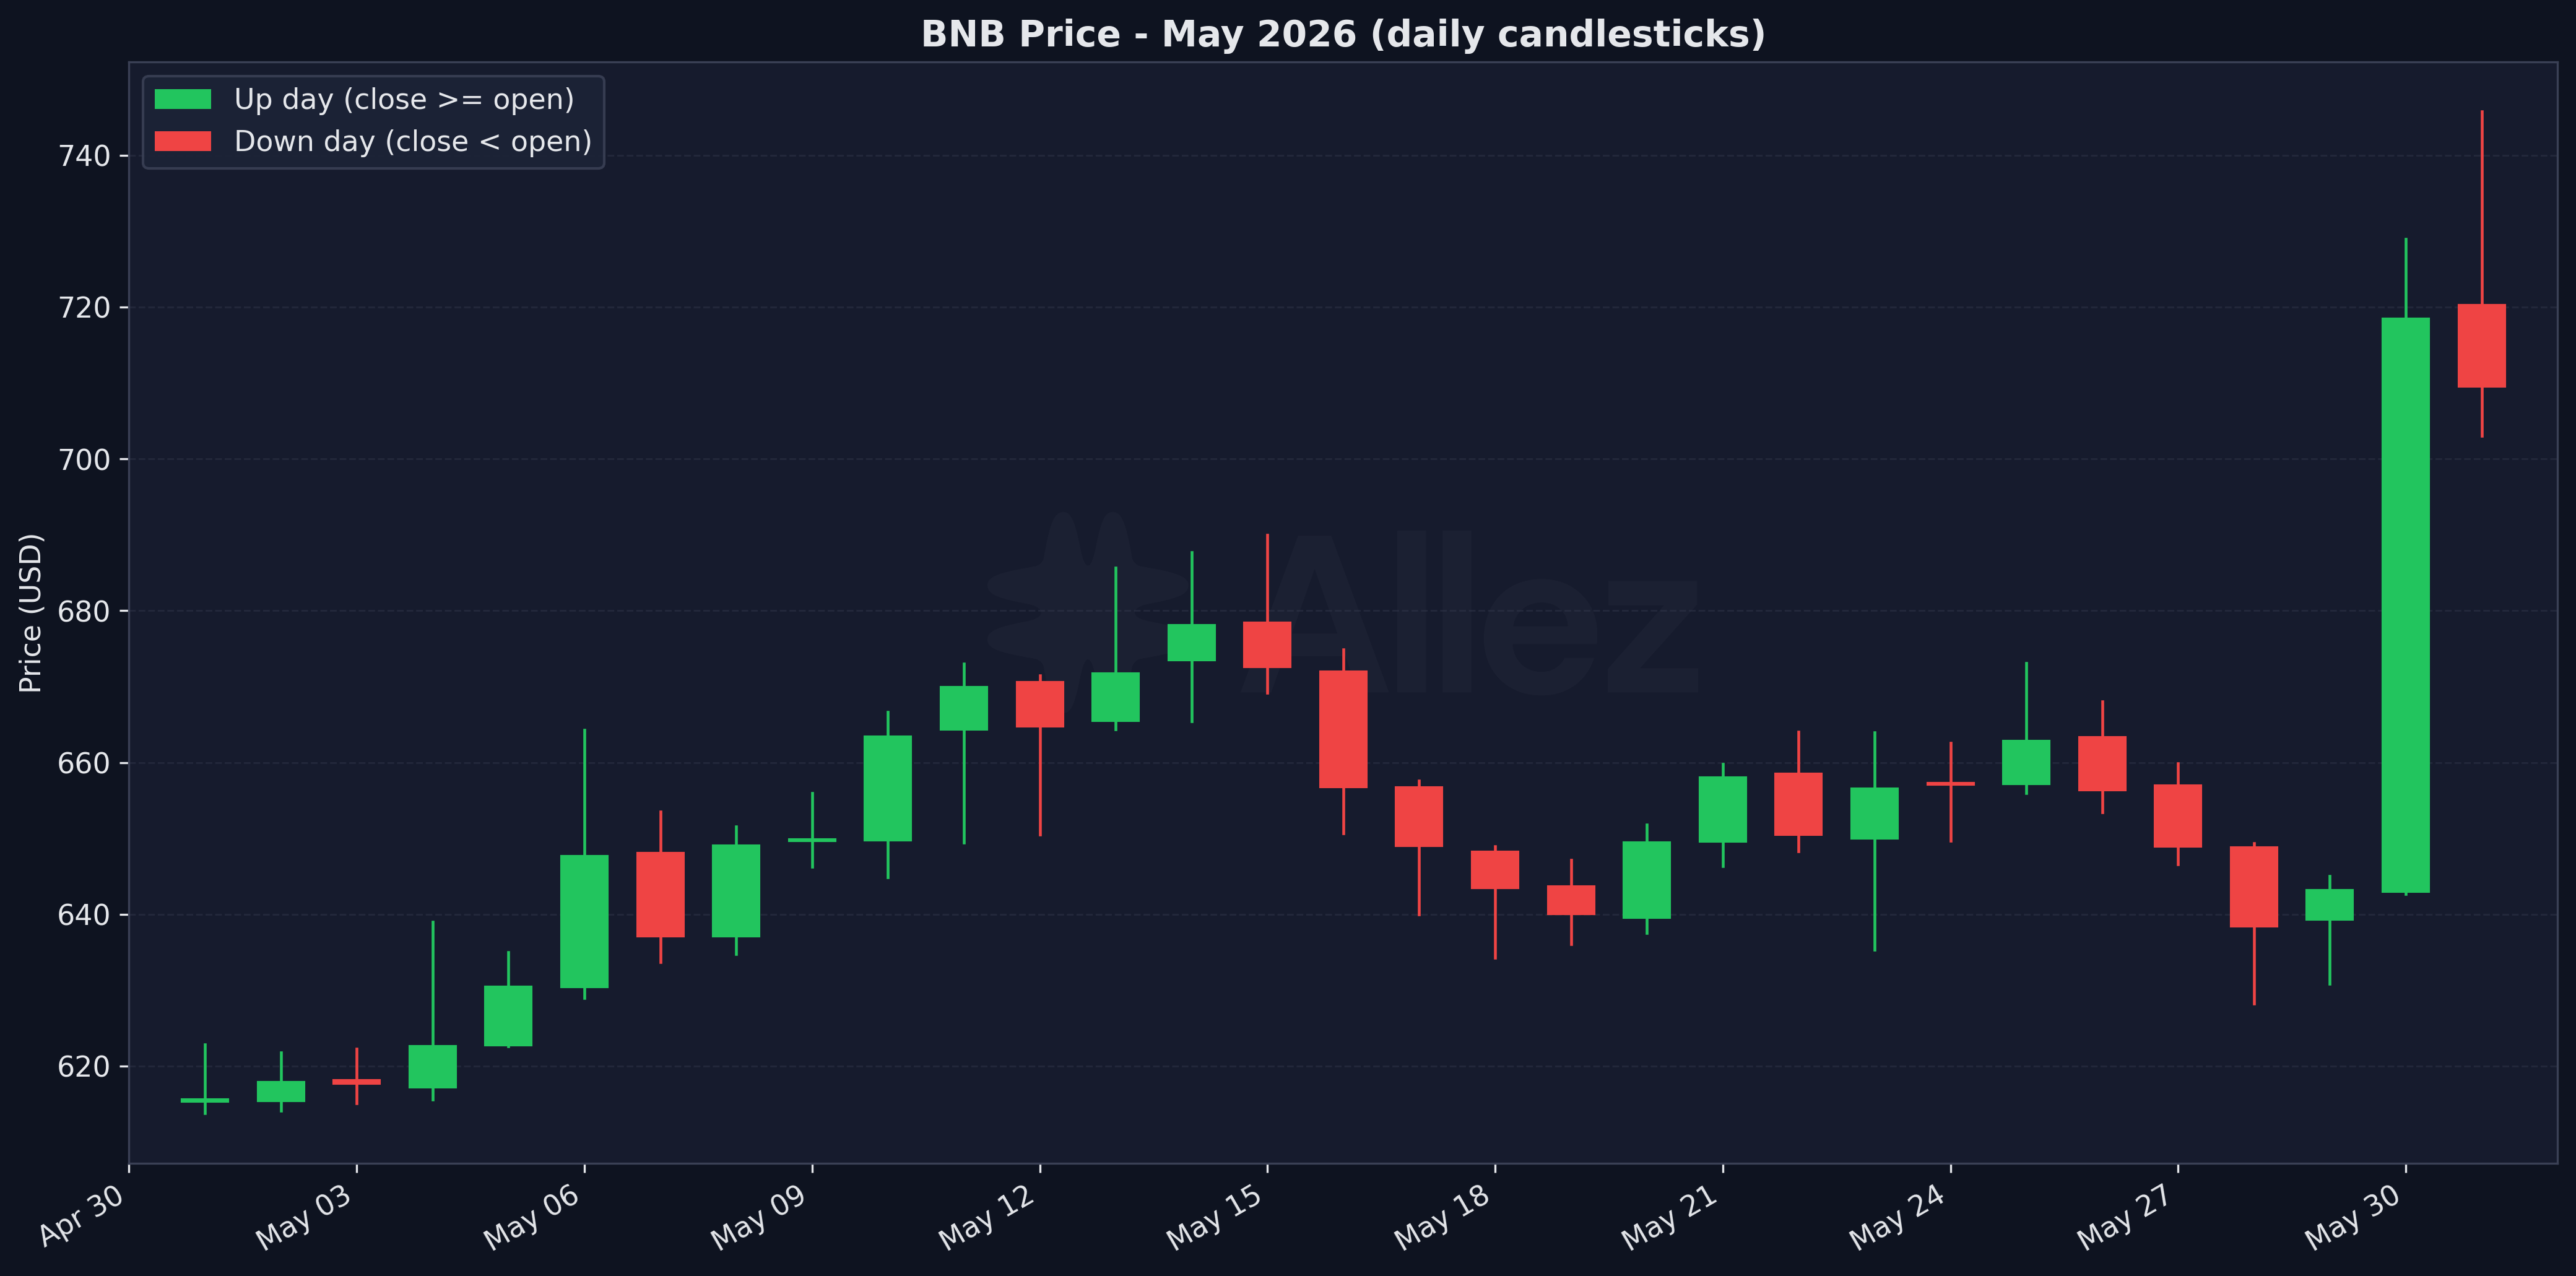
BNB Price - May 2026
2. Supply & Market Overview
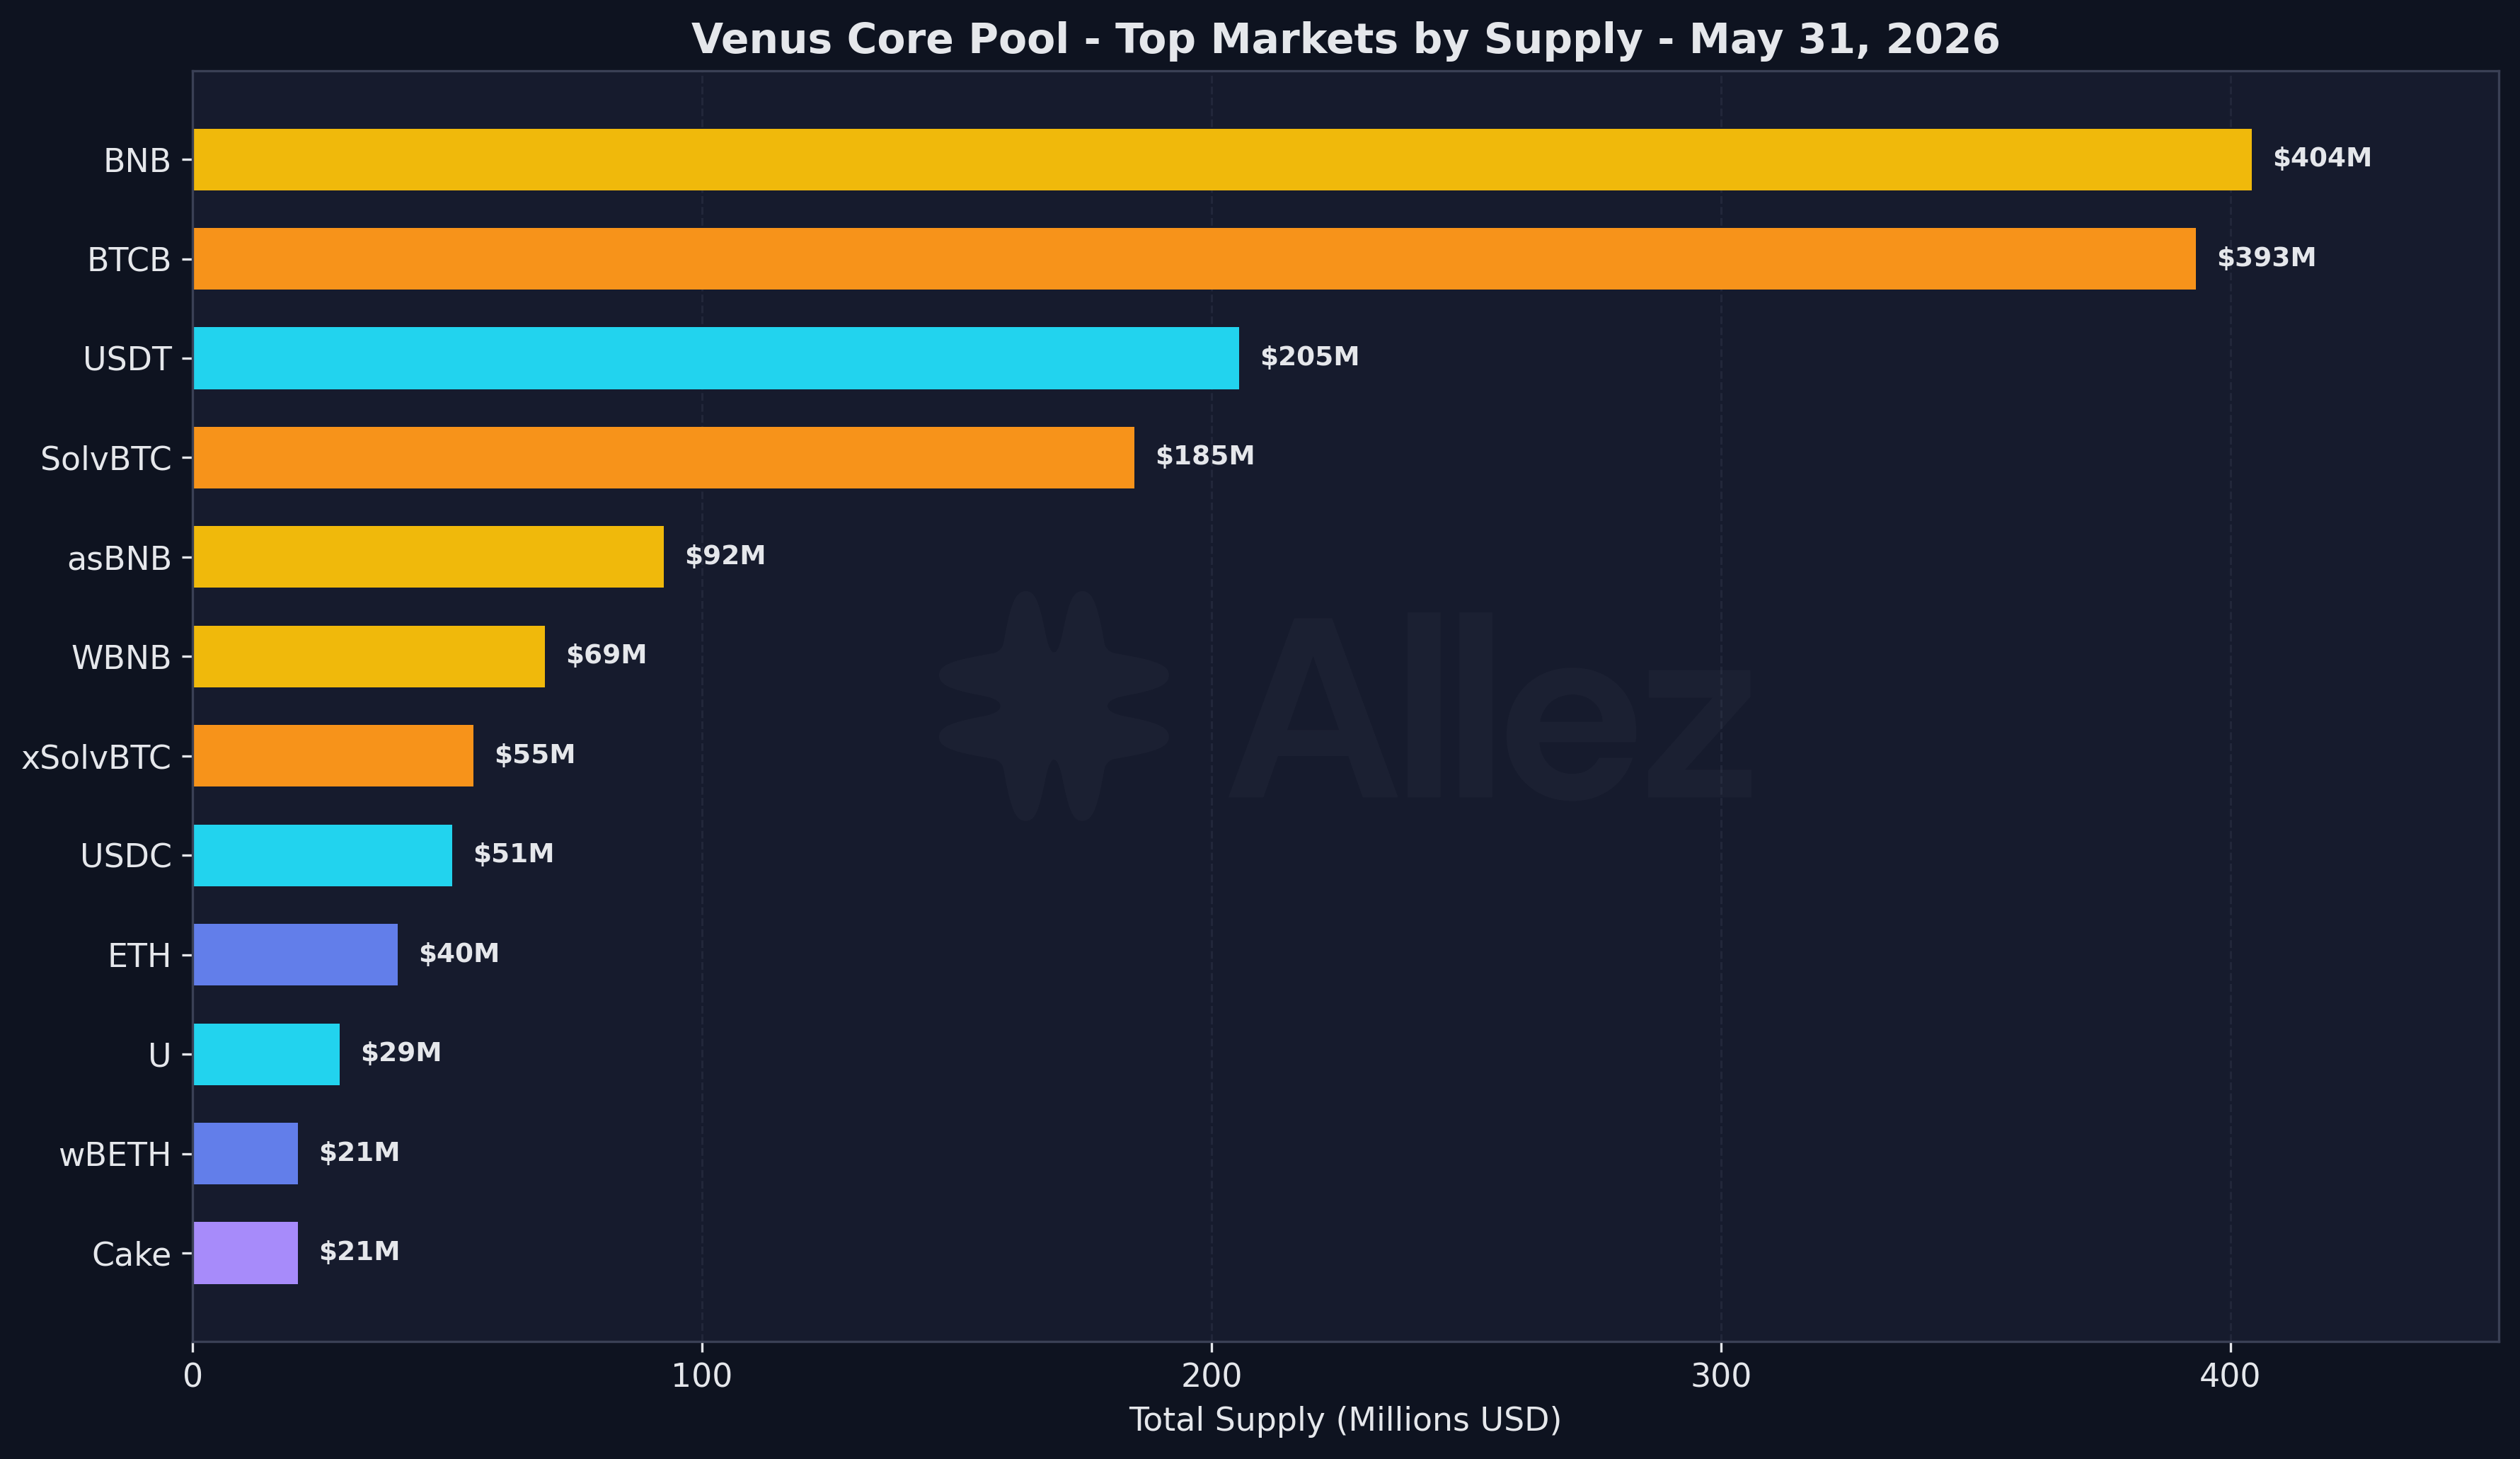
Supply by Market
Top markets by supply (May 31):
| Market | Supply | MoM | Debt | Util |
|---|---|---|---|---|
| BNB | $404M | +13.2% | $116M | 28.7% |
| BTCB | $393M | -12.1% | $121M | 30.8% |
| USDT | $205M | -7.3% | $119M | 57.9% |
| SolvBTC | $185M | +4.3% | $1M | 0.3% |
| asBNB | $92M | +12.4% | $0M | 0.0% |
| WBNB | $69M | +15.6% | $12M | 16.8% |
| xSolvBTC | $55M | -10.9% | $0M | 0.0% |
| USDC | $51M | -31.7% | $32M | 62.9% |
| ETH | $40M | -10.9% | $20M | 48.4% |
| U | $29M | +8.8% | $12M | 42.7% |
Several of the large moves in the table are driven by price, not flow. The BNB-leg markets rose ~16% in dollar terms, but token balances were flat to slightly lower (BNB -2.0%, asBNB -2.8%, WBNB flat), and ETH’s 10.9% dollar decline was purely the price drop, with token balances holding constant. The real flows were elsewhere: USDC saw the largest outflow (supply -31.7%, $74.6M to $50.9M, debt -21.3%), BTCB token holdings fell 9.3%, and SolvBTC was the only meaningful inflow (+7.4% in tokens).
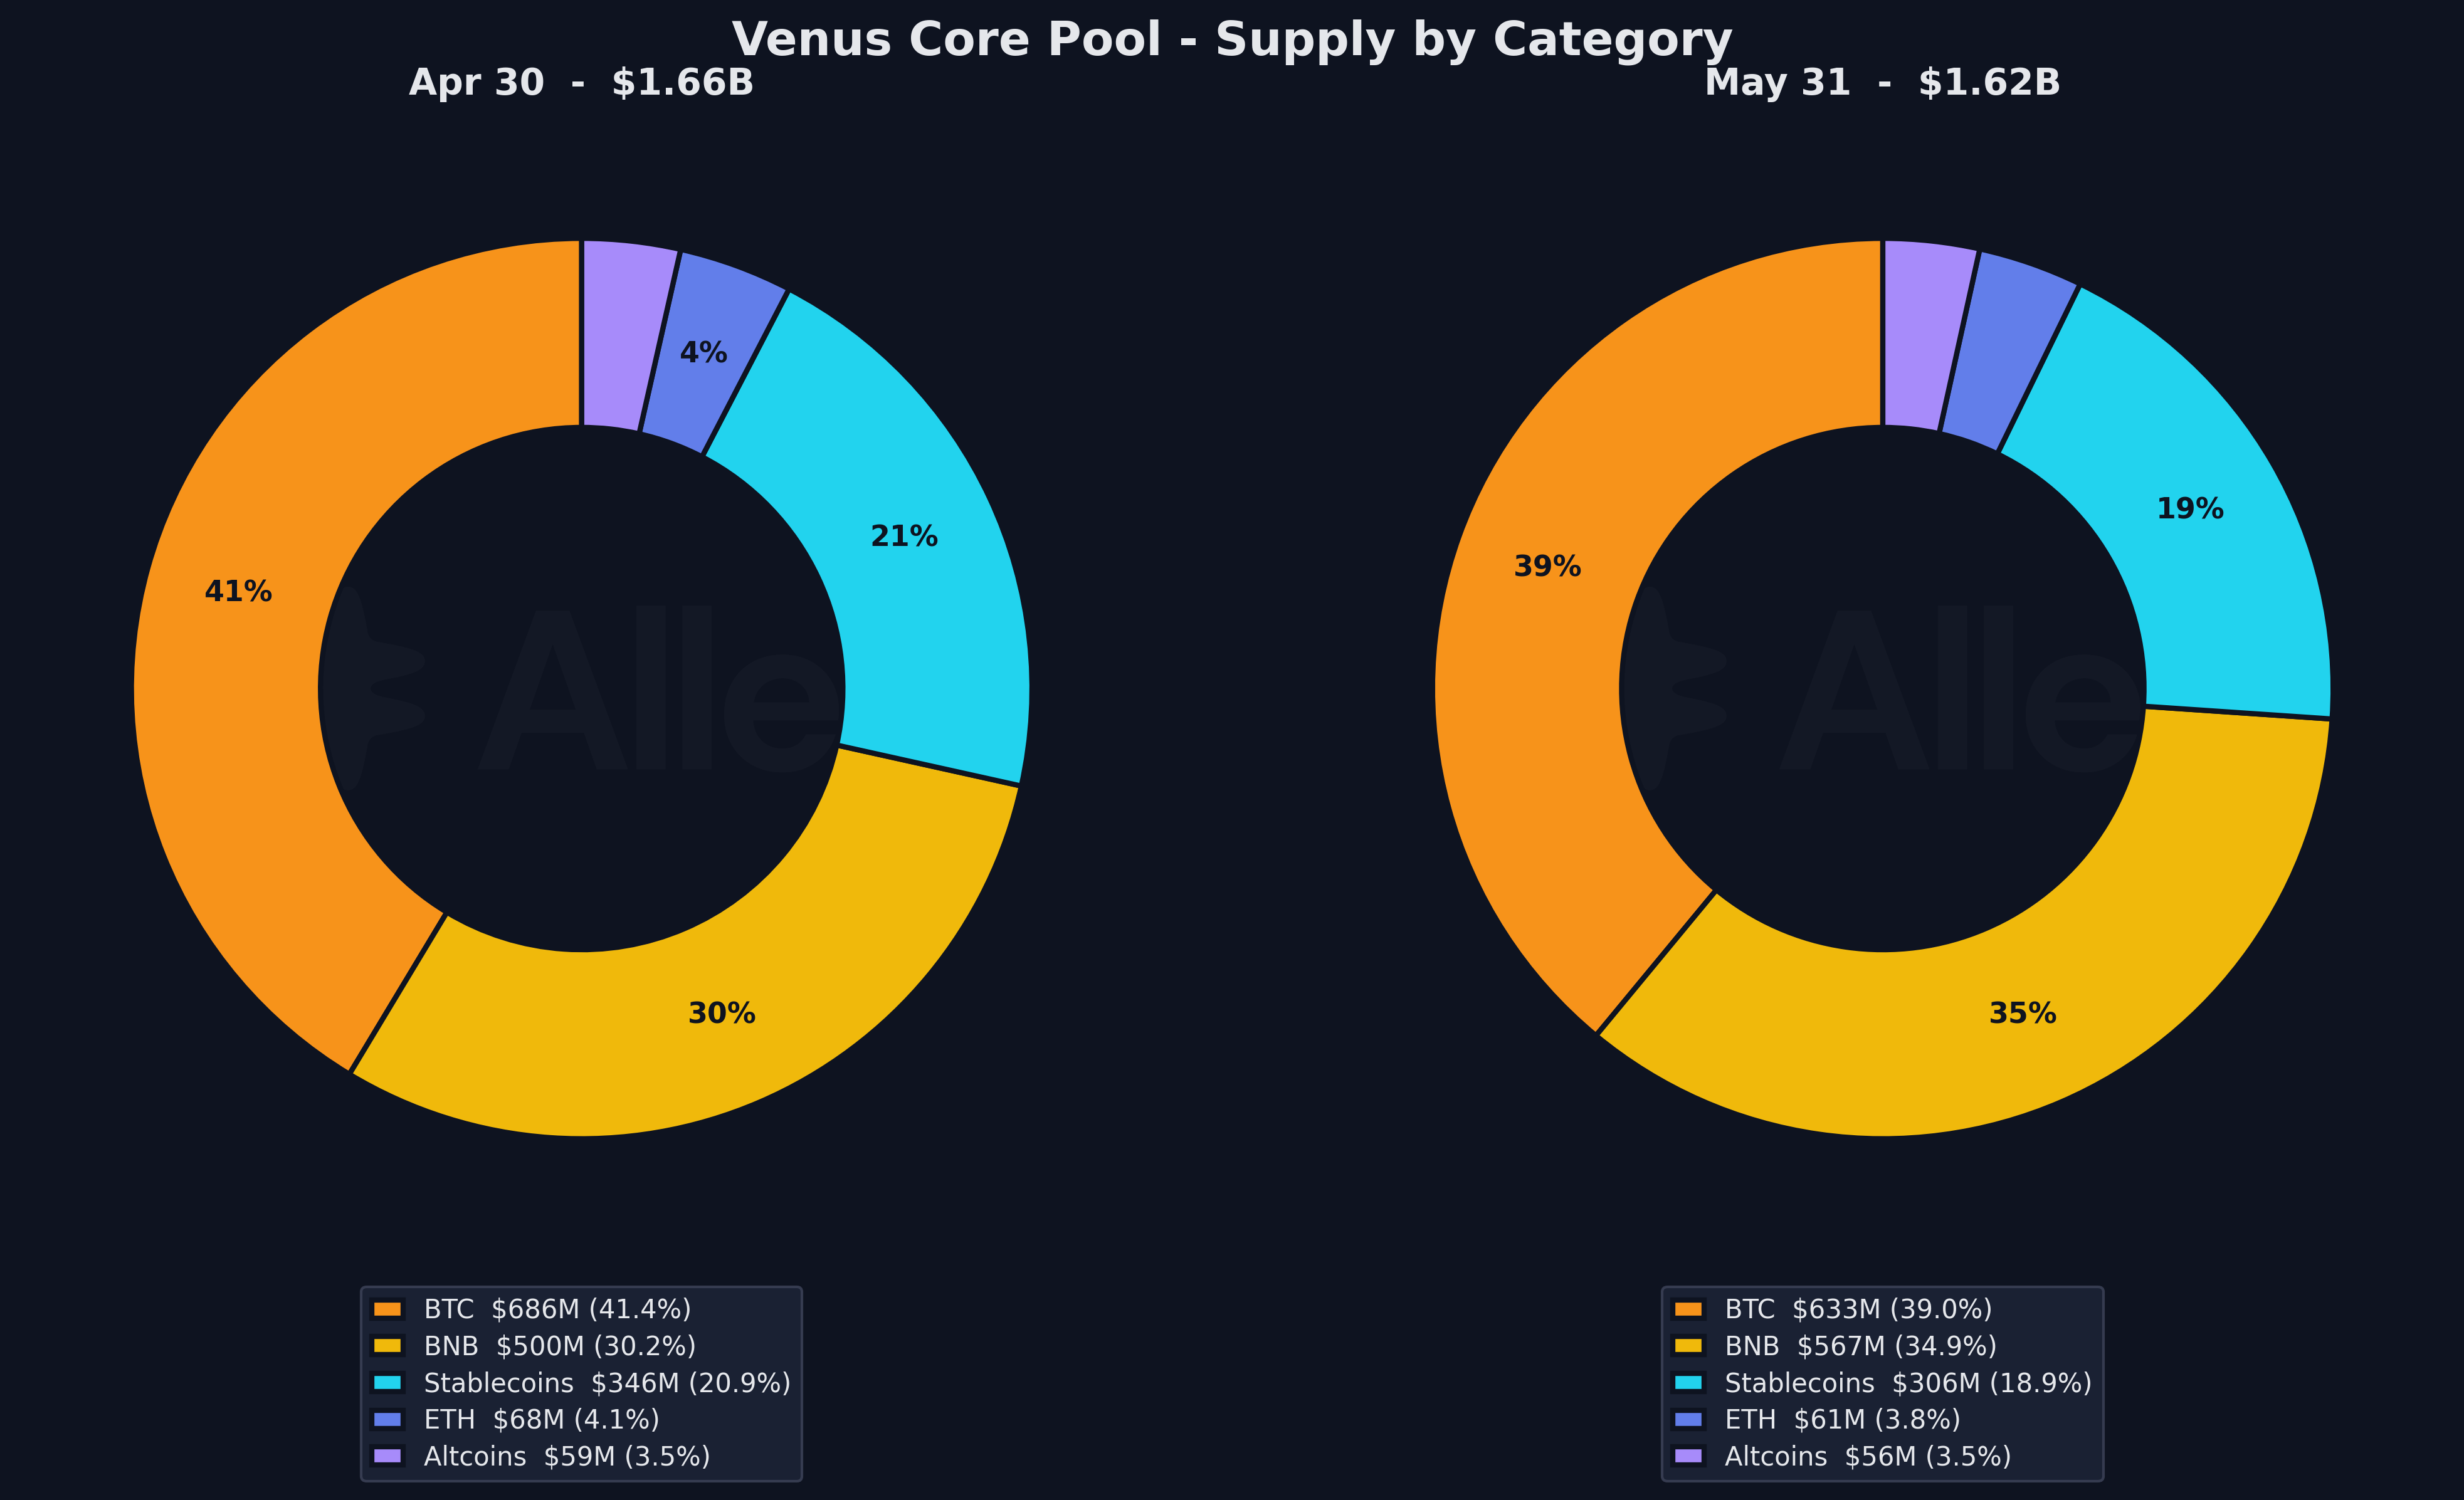
Category Composition
Category composition (May 31):
| Category | Supply | Share | MoM (pp) | Debt |
|---|---|---|---|---|
| BTC | $633M | 39.0% | -2.4 | $122M |
| BNB | $567M | 34.9% | +4.8 | $128M |
| Stablecoins | $306M | 18.9% | -2.0 | $176M |
| ETH | $61M | 3.8% | -0.3 | $20M |
| Altcoins | $56M | 3.5% | -0.1 | $2M |
BNB’s share of supply rose almost 5 points to 34.9% on the rally, while BTC slipped to 39.0% on real BTCB outflows and stablecoins gave back 2 points on the USDC outflow and DAI off-boarding.
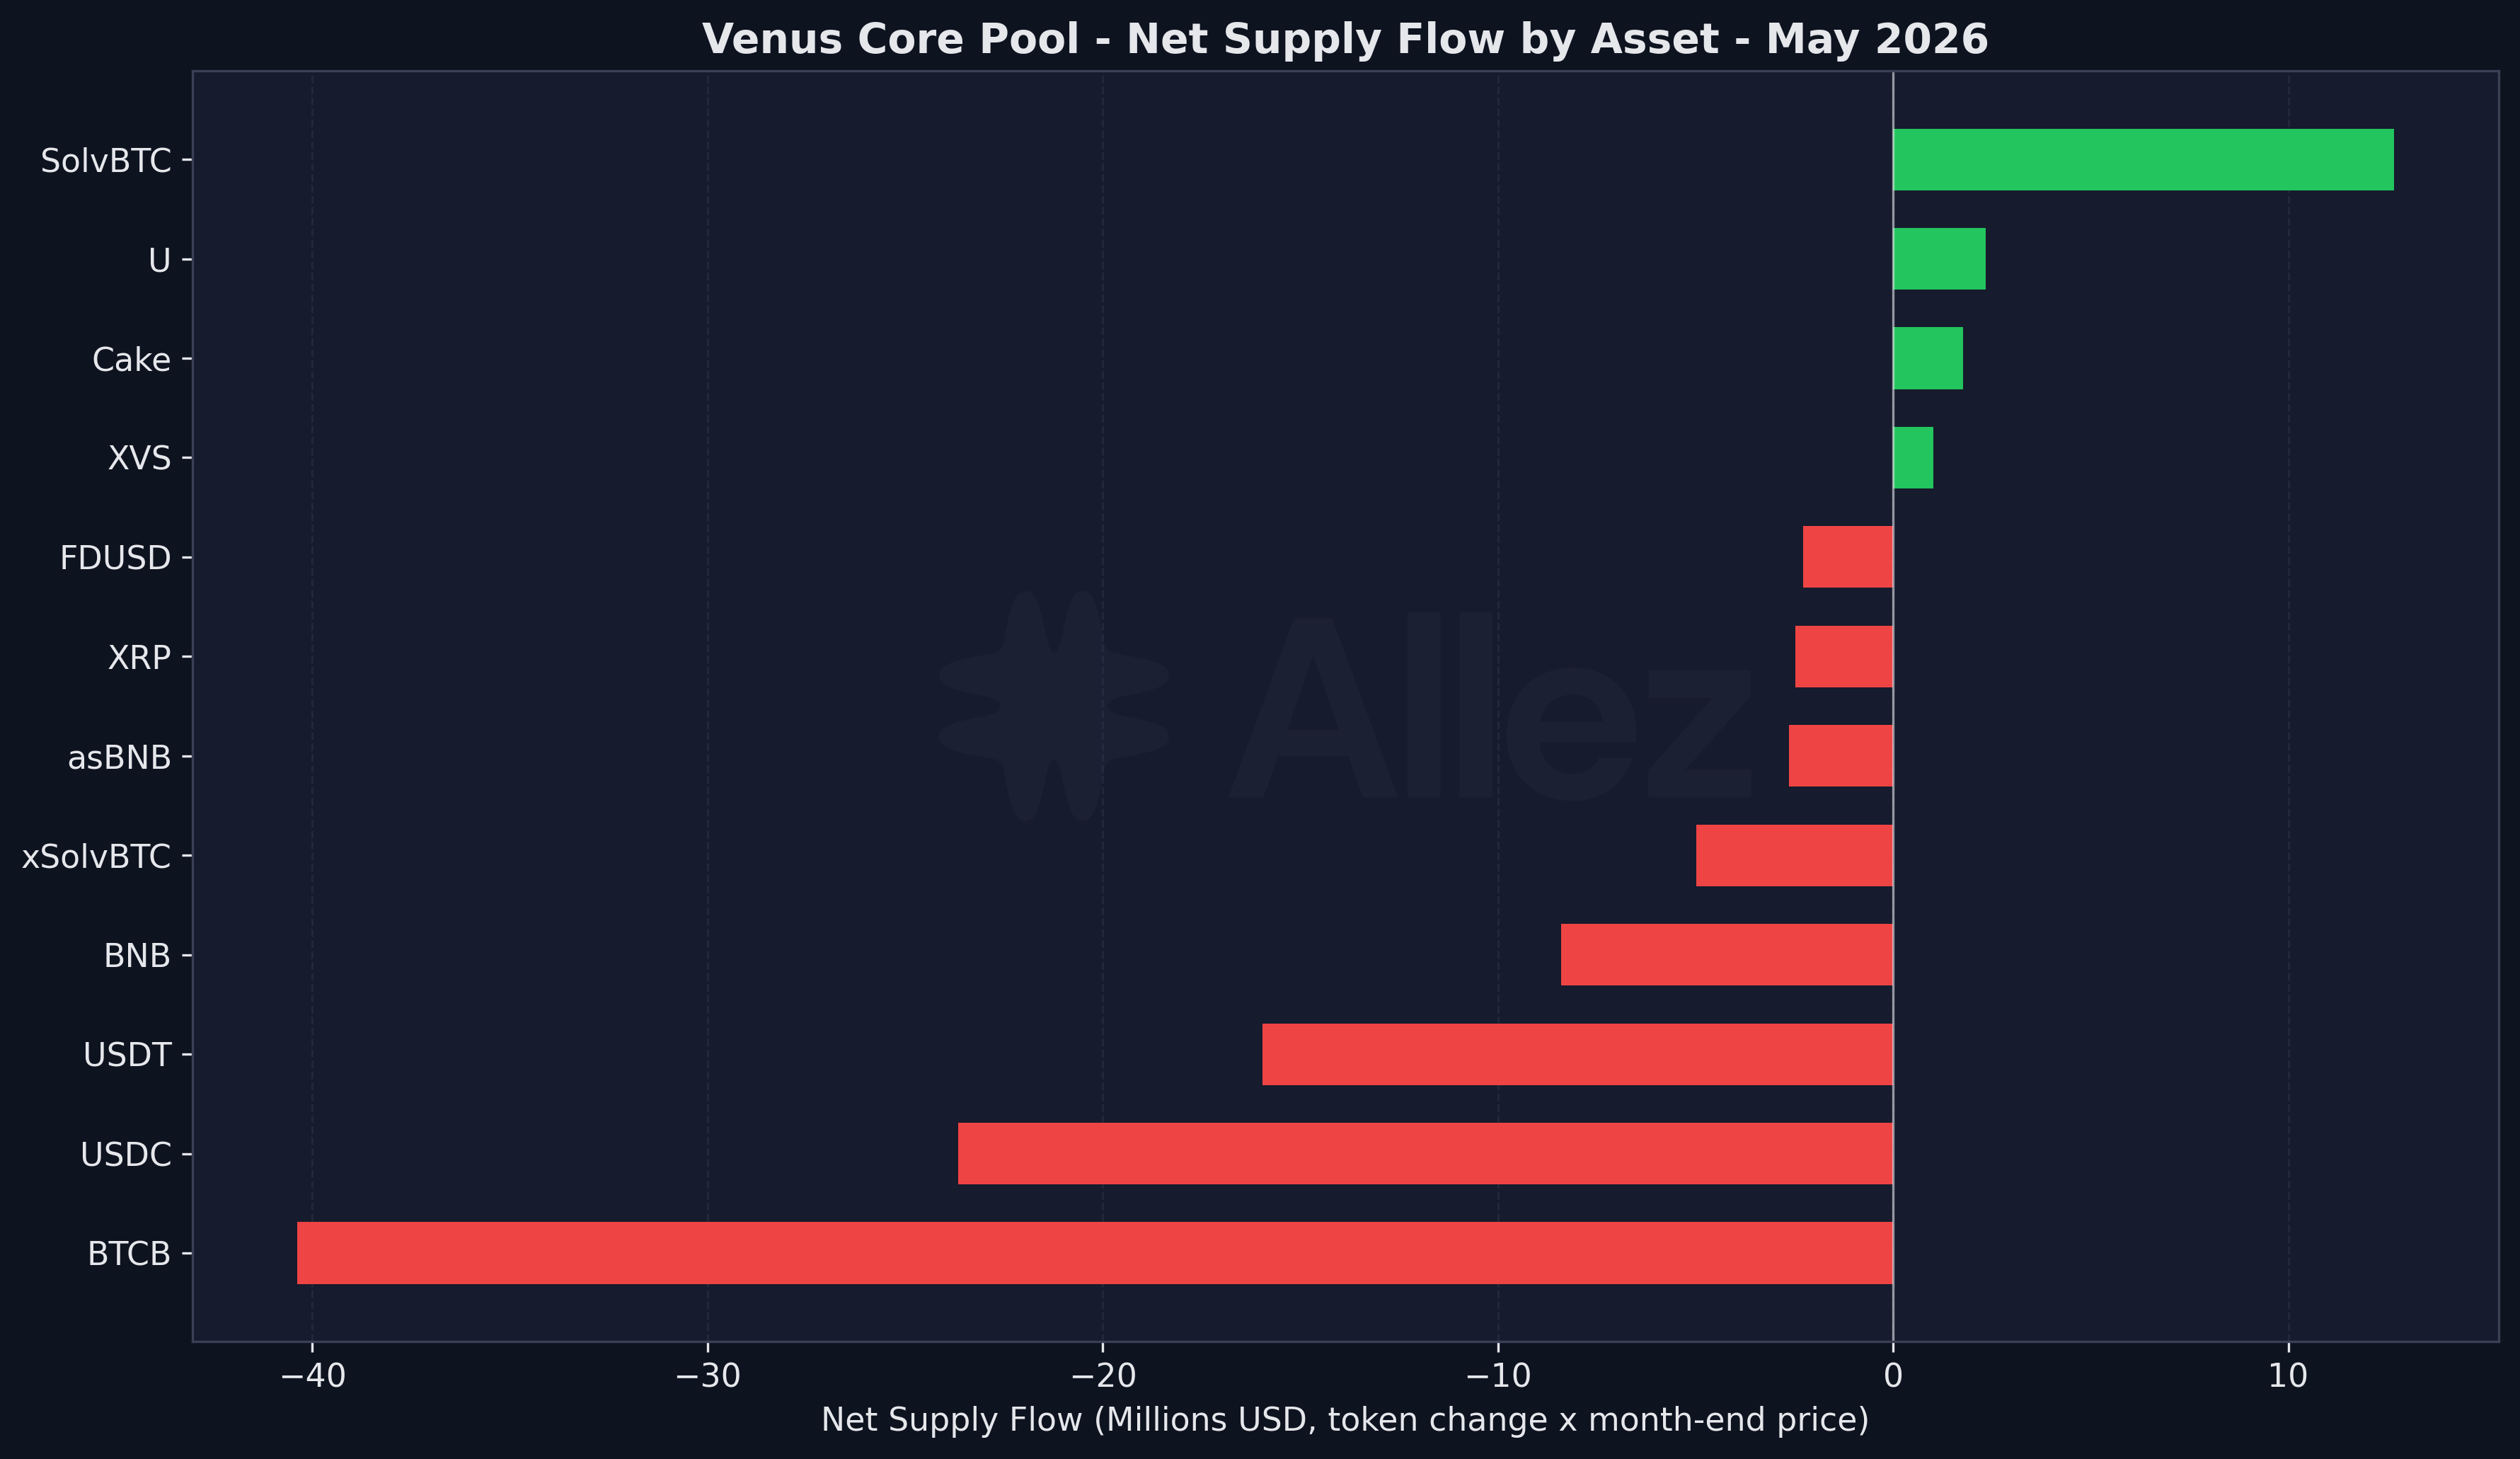
Net Supply Flow by Asset
The debt-change view below is dominated by the ETH unwind covered in the Utilization section. The net-flow view isolates real deposits and withdrawals from the BNB and BTC price moves: BTCB and USDC were the largest outflows, SolvBTC the only sizeable inflow.
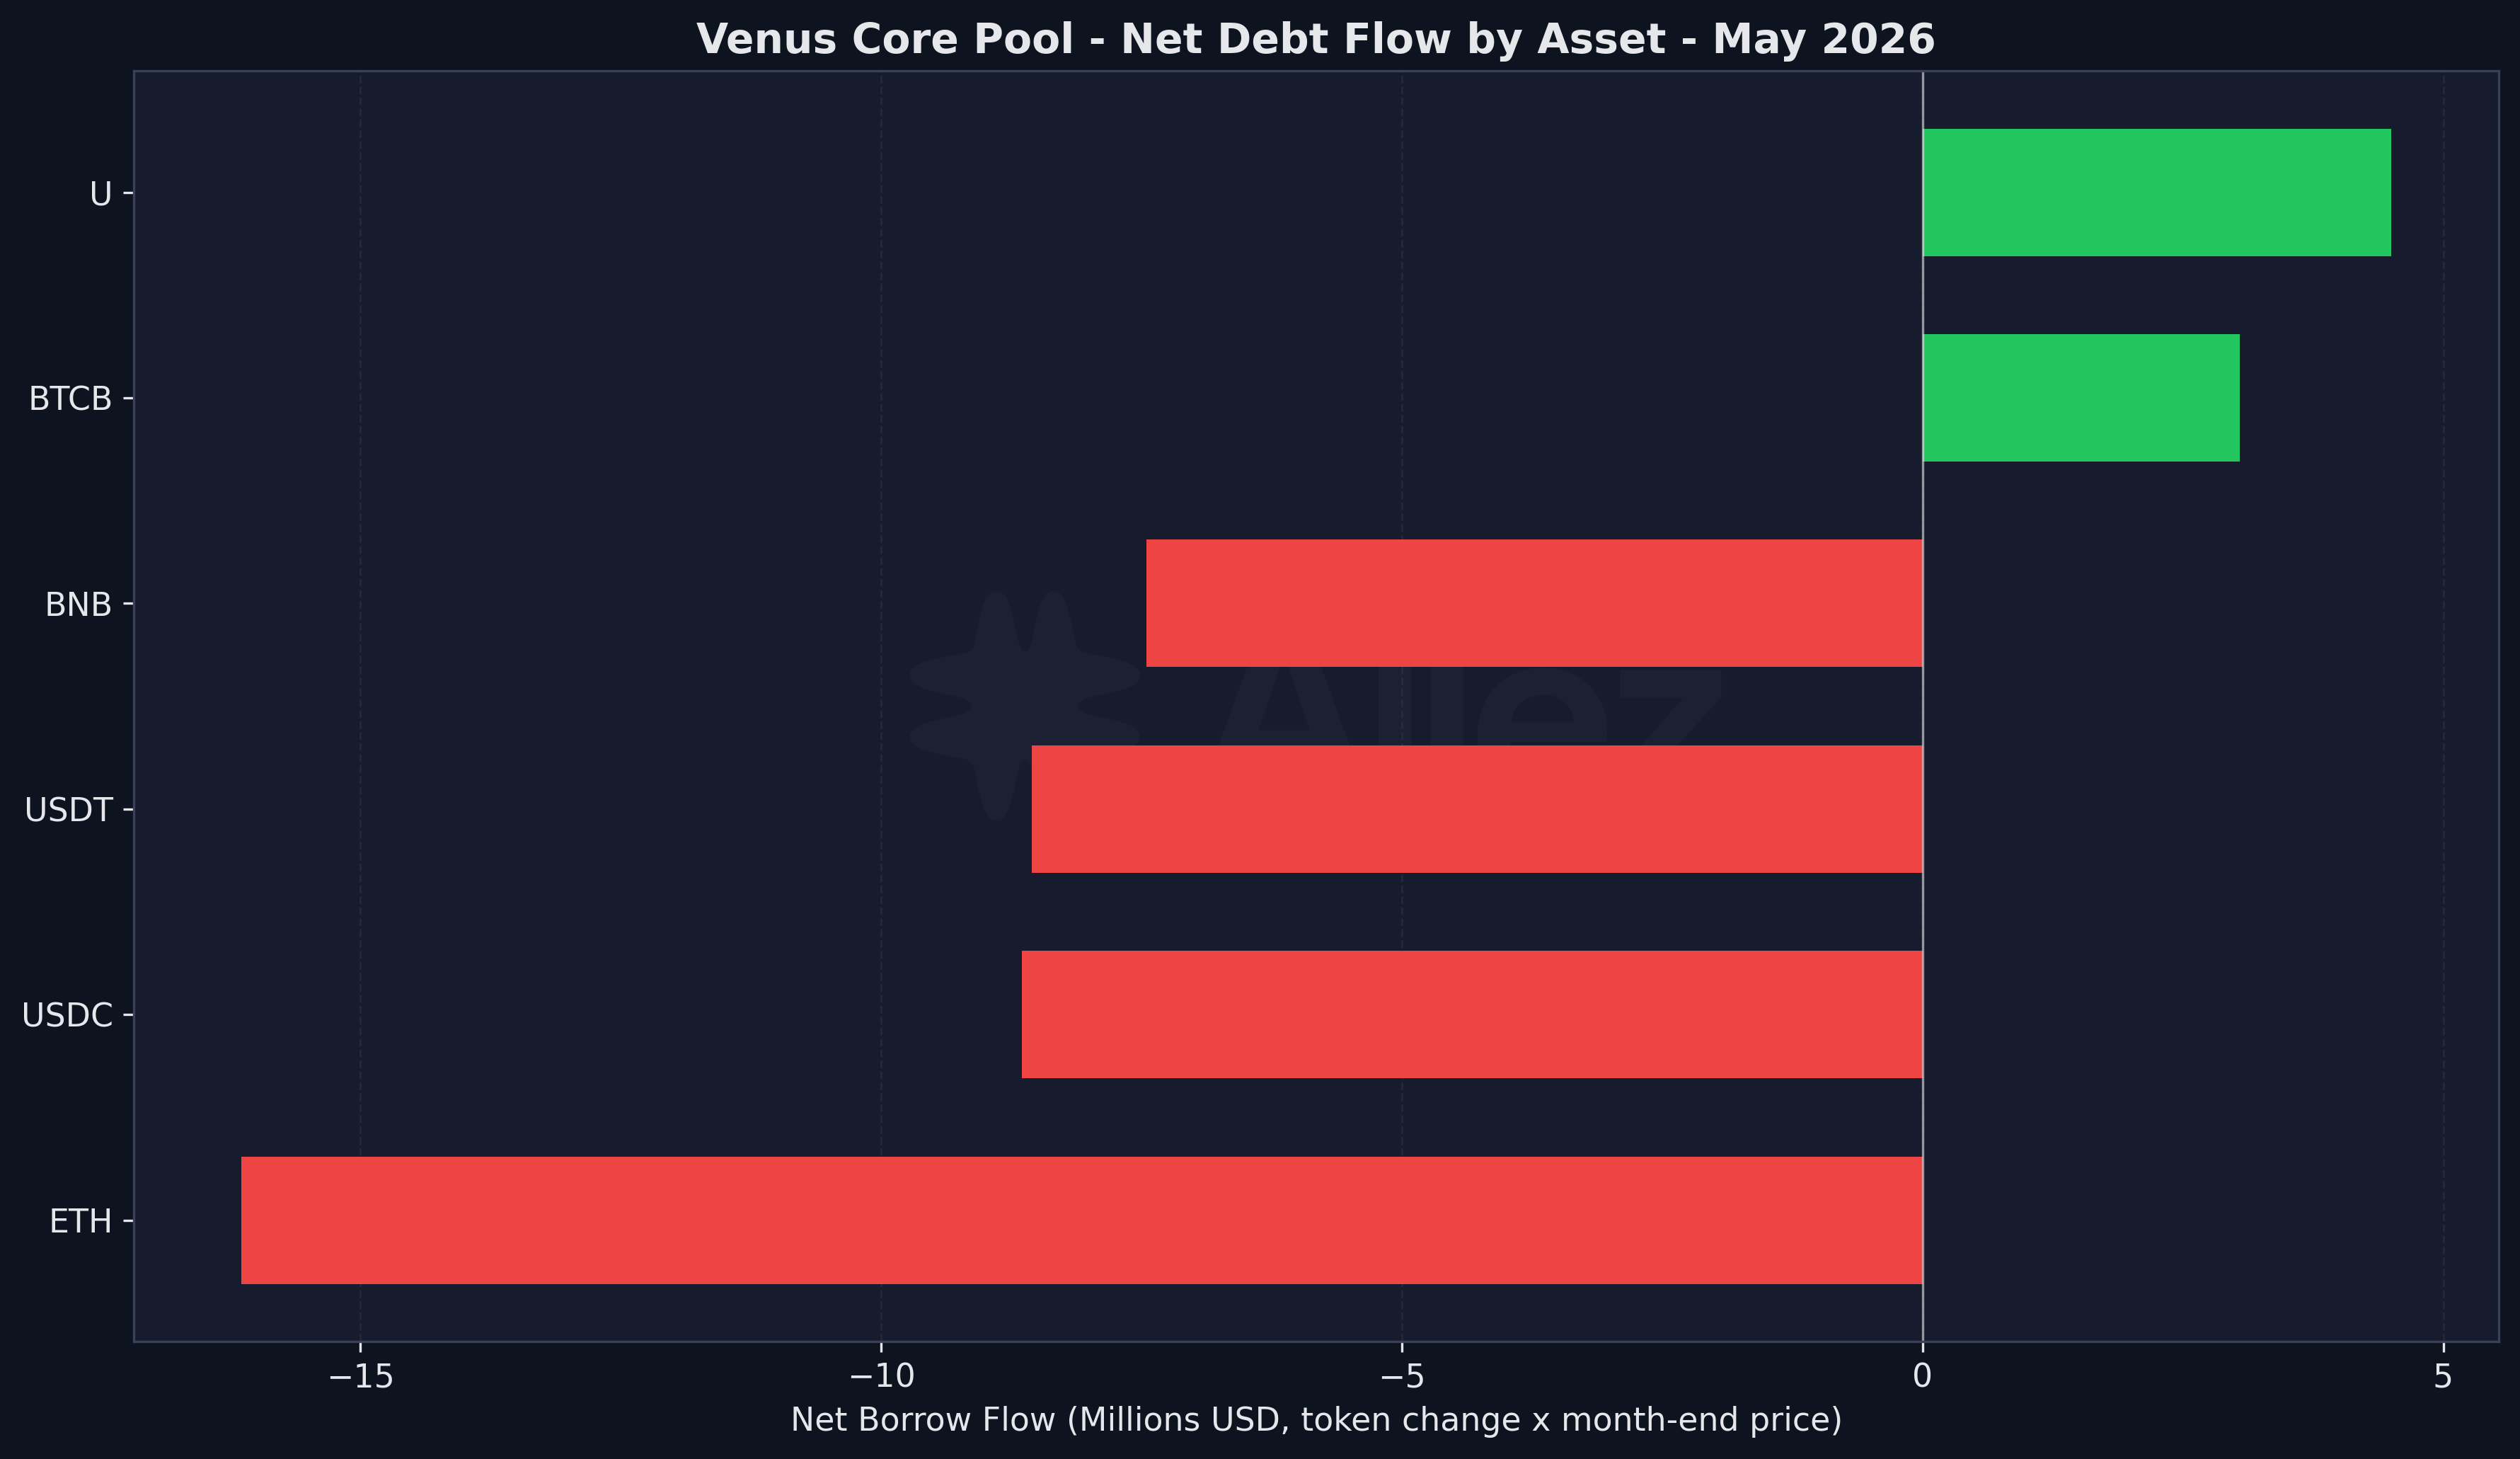
Net Debt Flow by Asset
Note: Charts show net user flow, the month’s token-quantity change valued at the May 31 price. This isolates deposit and withdrawal behavior from price effects, so a market like BNB (token balance roughly flat, price up 15%) reads as the small outflow it actually was rather than a price-led gain.
3. Risk & Liquidations
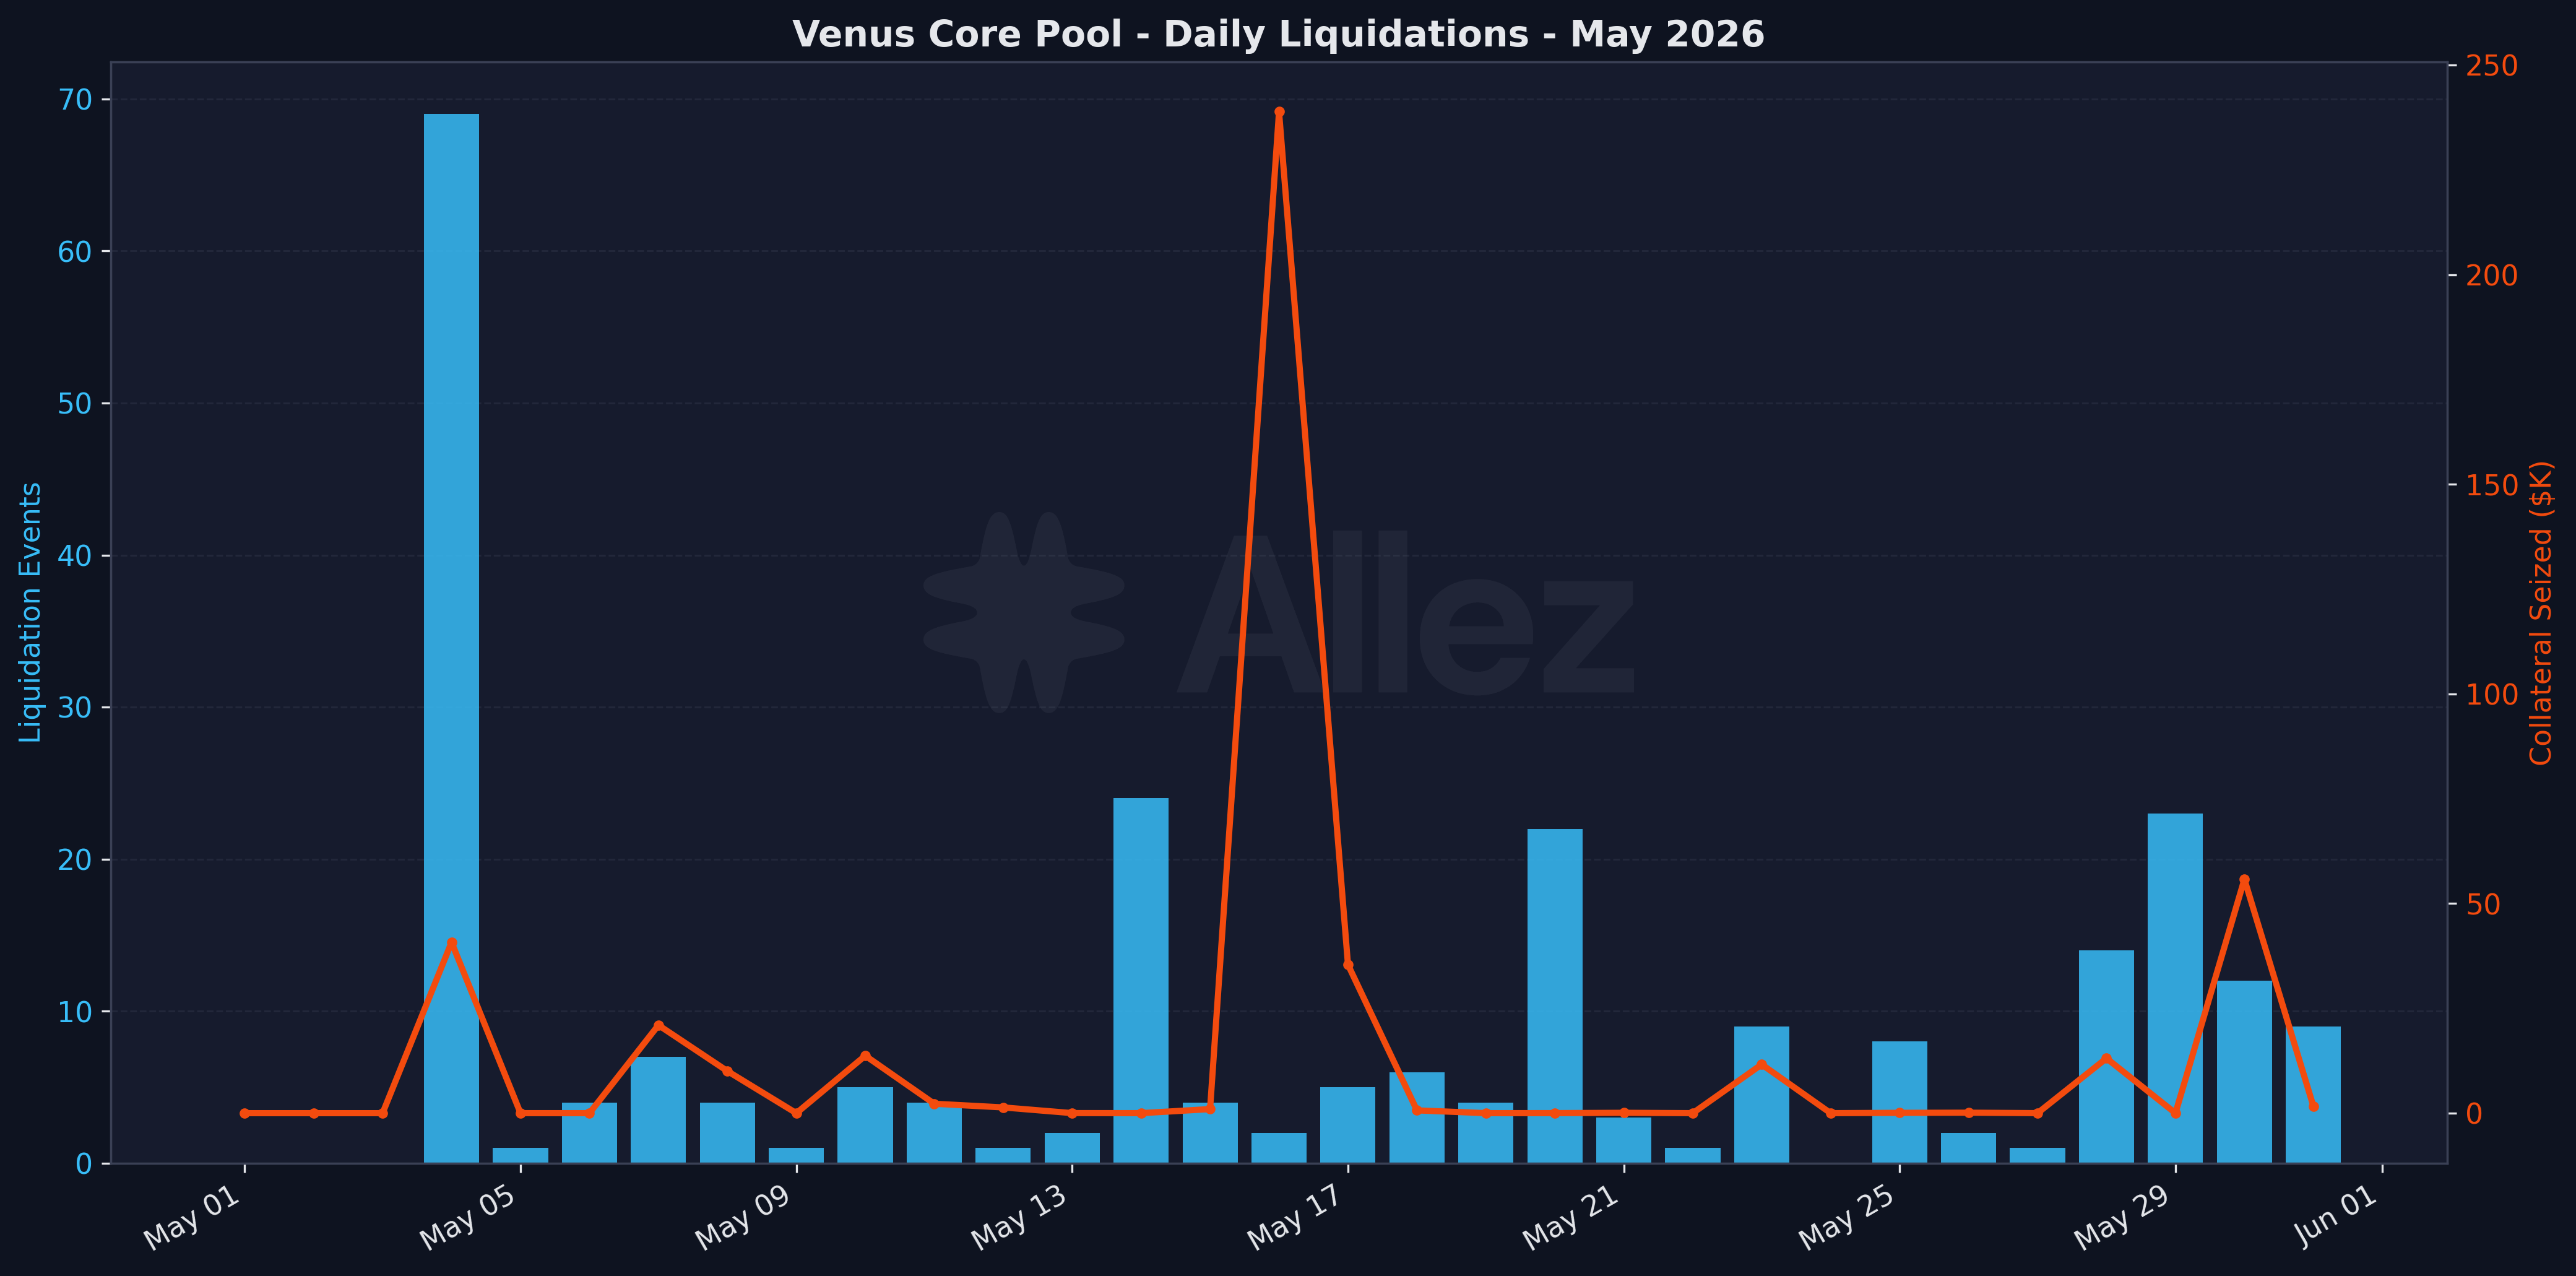
Daily Liquidations
The 247 liquidation events seized $447.5K, with $238.8K stemming from a single ETH-collateralized liquidation on May 16.
Liquidation summary:
| Metric | May Total |
|---|---|
| Total events | 247 |
| Collateral seized | $447.5K |
| Peak seized day | May 16 ($238.8K) |
| Peak event-count day | May 4 (69 events) |
Top collateral by seized value:
| Collateral | Seized | Events |
|---|---|---|
| ETH | $295.2K | 32 |
| BTCB | $76.3K | 33 |
| BNB | $50.1K | 34 |
| USDT | $8.8K | 45 |
| AAVE | $2.3K | 11 |
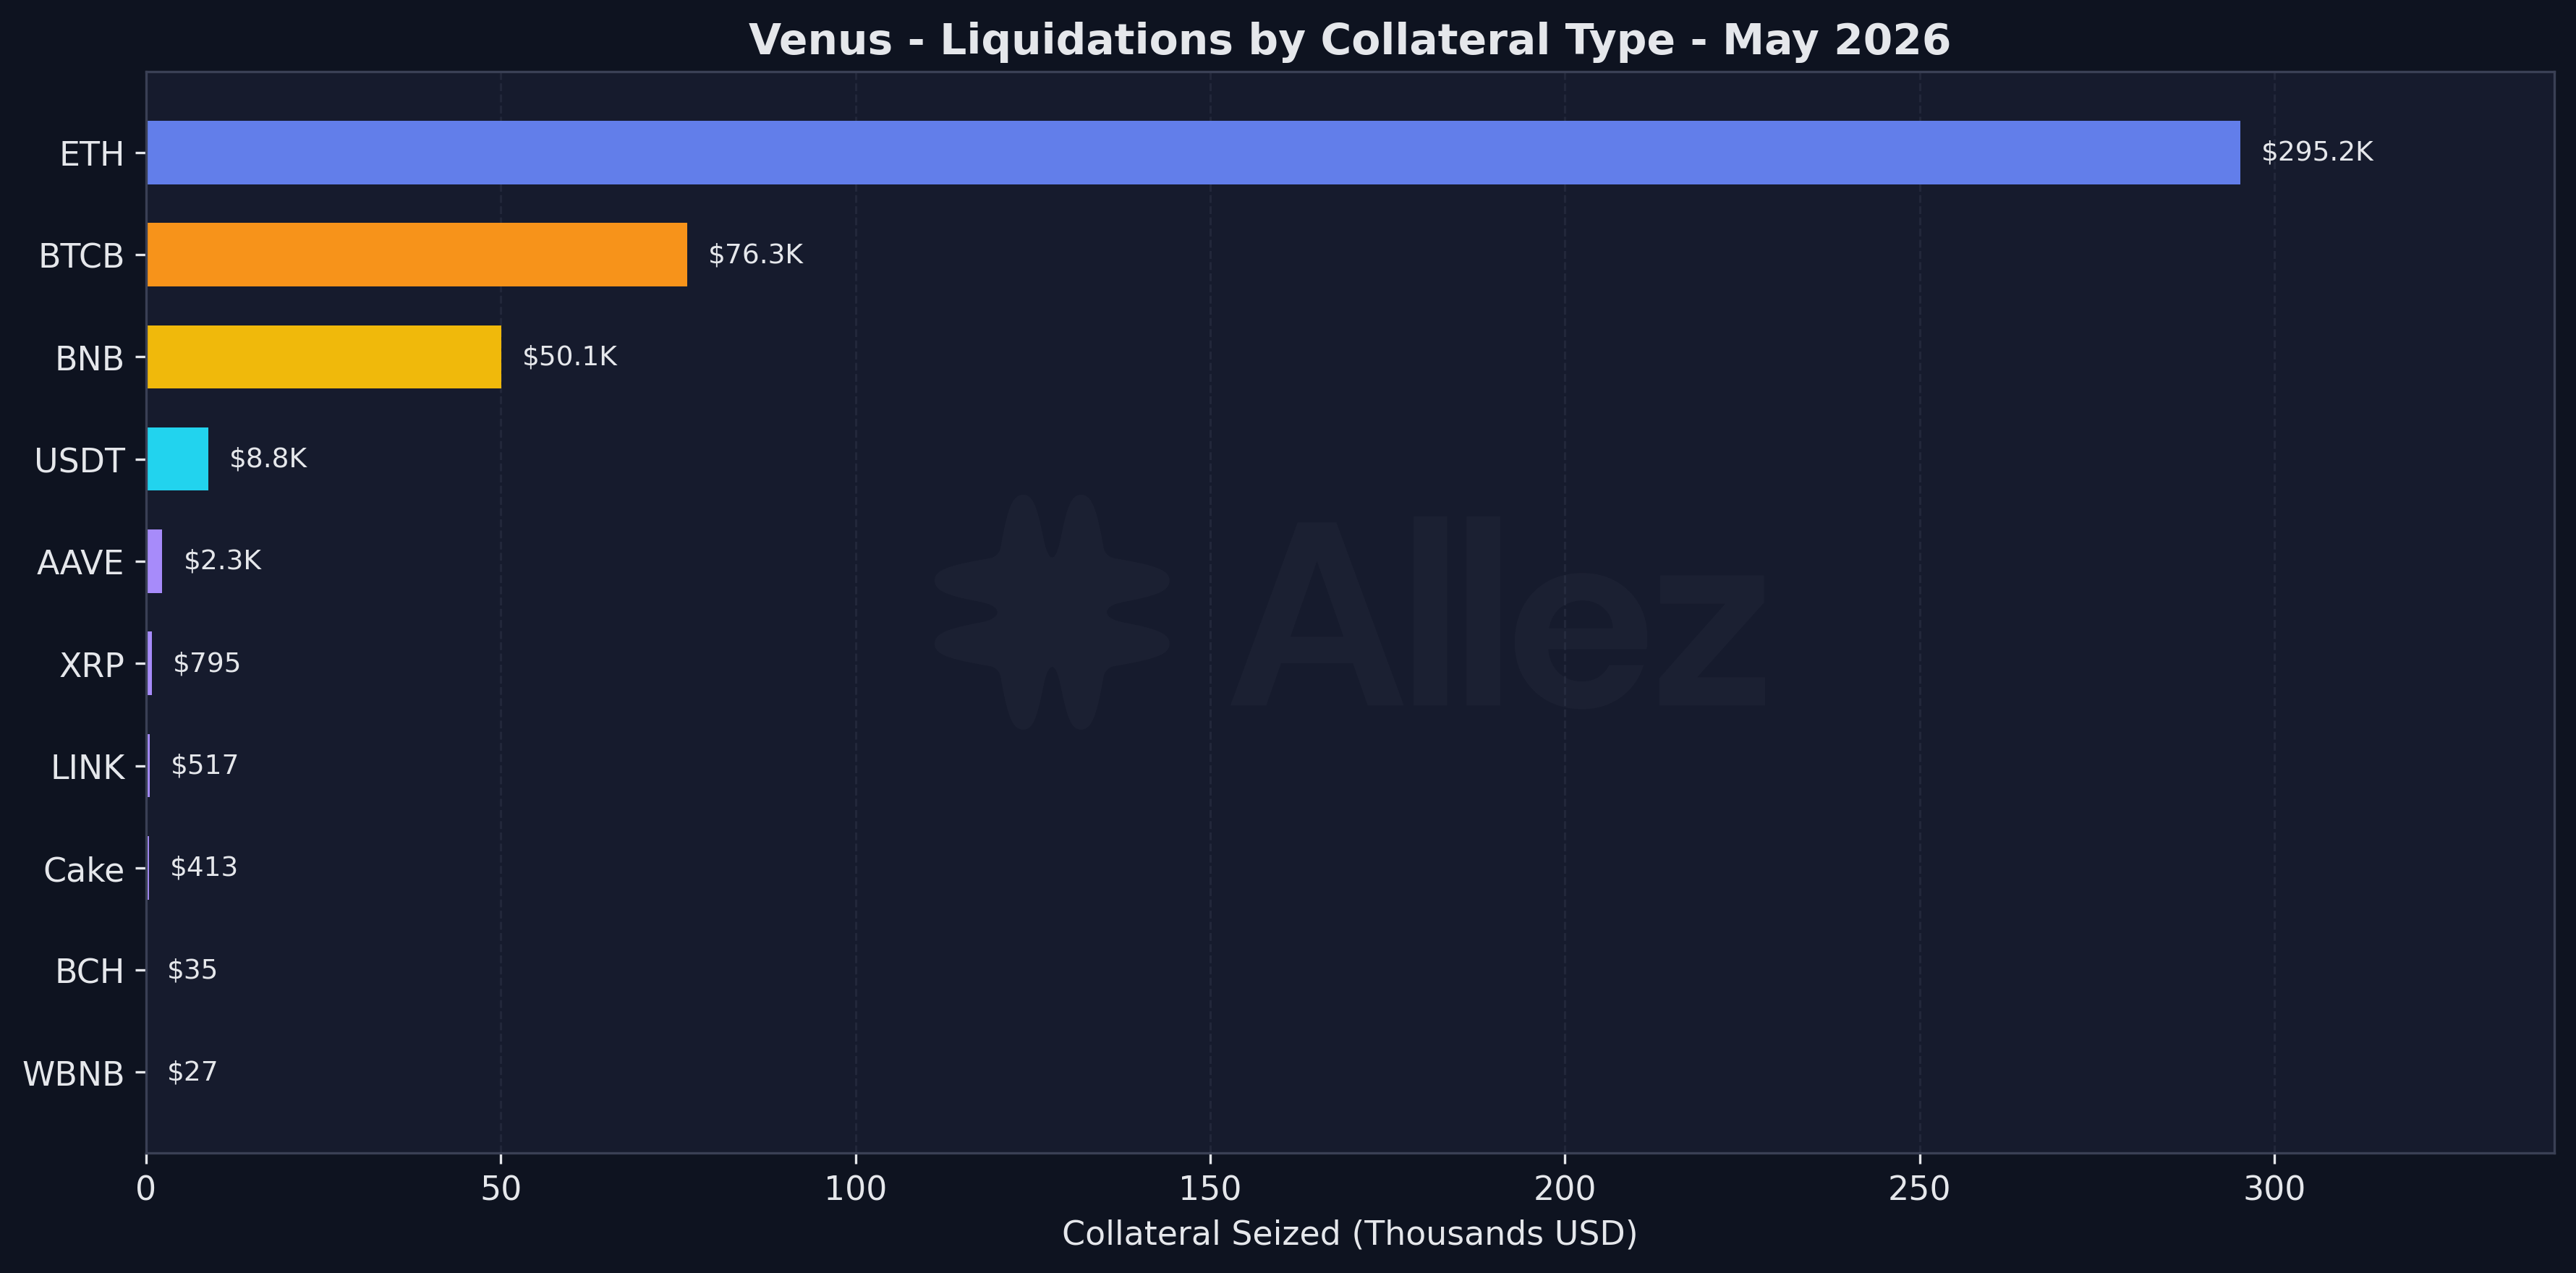
Liquidations by Collateral
Health factor distribution (May 31):
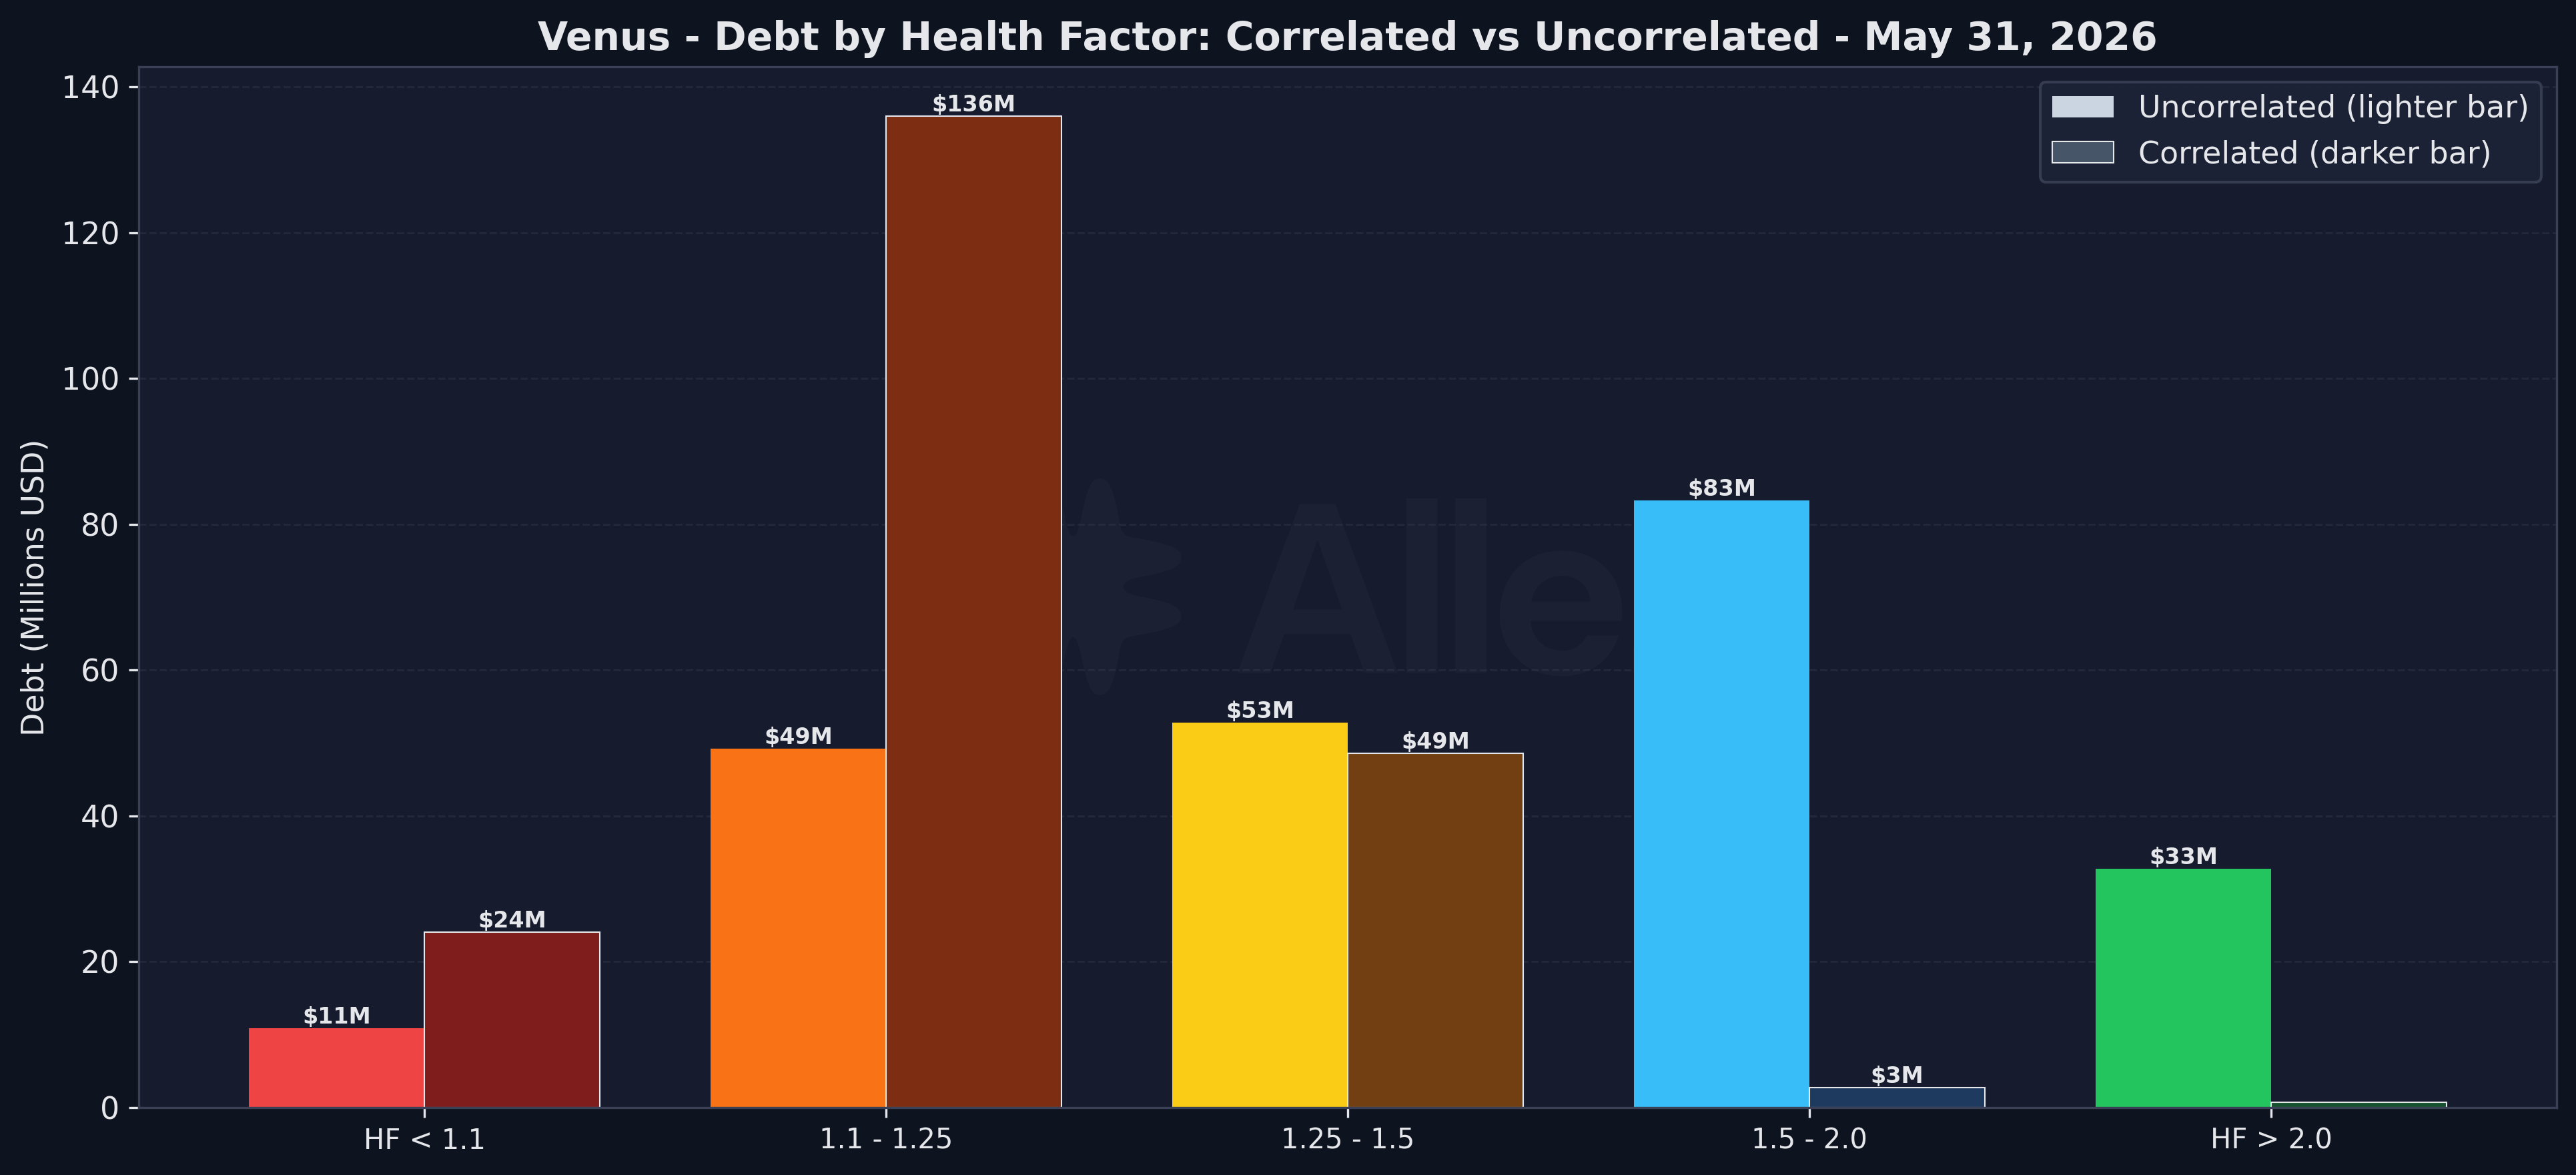
Health Distribution - Correlated vs Uncorrelated
Correlated debt (E-mode loops like SolvBTC against BTCB or asBNB against BNB) is fundamentally different from uncorrelated debt. Correlated debt carries de-peg and redemption risk rather than directional price risk: at a health factor near 1.1, a correlated asset would need to decline 9% relative to its underlying to liquidate. Uncorrelated debt (BNB or stablecoins borrowed against unrelated collateral) carries the directional risk.
| Health Factor | Correlated Debt | MoM | Corr. Pos. | Uncorrelated Debt | MoM | Uncorr. Pos. |
|---|---|---|---|---|---|---|
| <1.1 | $24.0M | +8.1% | 96 | $10.9M | -32.3% | 51 |
| 1.1-1.25 | $136.0M | +54.7% | 216 | $49.2M | +37.0% | 367 |
| 1.25-1.5 | $48.6M | -52.7% | 141 | $52.8M | +1.9% | 709 |
| 1.5-2.0 | $2.8M | -3.4% | 61 | $83.3M | -22.5% | 812 |
| >2.0 | $0.7M | +16.7% | 91 | $32.8M | -14.6% | 1,176 |
Most of the swing into the 1.1-1.25 band is correlated E-mode leverage, $136.0M across just 216 positions. Both legs of these positions track the same asset, so this is structural leverage rather than new directional risk. The genuinely directional price exposure was reduced, with uncorrelated debt below 1.1 falling 32% to $10.9M, while total uncorrelated debt below 1.25 rose from $52.0M to $60.1M.
Stablecoin debt by collateral:
| Collateral | Stablecoin Debt | Within 10% of Liquidation |
|---|---|---|
| BTCB | $73.3M | $3.5M |
| SolvBTC | $34.5M | $0.0M |
| BNB | $28.3M | $0.1M |
| ETH | $9.0M | $0.2M |
| USDT | $7.9M | $5.5M |
| wBETH | $6.8M | $4.3M |
Stablecoin debt against volatile collateral is conservative, with only $8.1M sitting within 10% of liquidation. The largest single exposure is wBETH, where $4.3M of the $6.8M it backs is near its threshold, making it the position most exposed to a further ETH decline.
Borrower concentration:
The five largest borrowers carry $163M of debt, 36% of the protocol total, with the top three at $130M (29%). Four of the five run correlated or E-mode structures, so their tight health factors (1.08 to 1.23) are structural and unwind within the same asset family at low market impact. The exception is the third-largest, $30.2M of BNB borrowed against BTCB and USDT collateral at a 1.14 health factor: effectively short BNB, the one large position May’s rally made riskier. Figures are the May 31 position snapshot, with shares taken against total protocol debt of $449M.
4. Collateral Structure
Top collateral/borrow pairs:
| Collateral | Borrowed | Debt | Apr Debt | MoM | Users |
|---|---|---|---|---|---|
| SolvBTC | BTCB | $51.3M | $52M | -1% | 22 |
| BTCB | USDT | $48.0M | $48M | 0% | 2,174 |
| asBNB | BNB | $40.9M | $37M | +11% | 37 |
| xSolvBTC | BTCB | $36.5M | $42M | -13% | 13 |
| BTCB | BNB | $32.0M | $34M | -6% | 1,877 |
| SolvBTC | USDT | $31.4M | $34M | -8% | 23 |
| BTCB | BTCB | $23.6M | $25M | -6% | 601 |
April pair debt is reported to the nearest $M.
The concentrated E-mode loops (SolvBTC/BTCB, xSolvBTC/BTCB, asBNB/BNB, the BTCB self-borrow) each have fewer than 40 users, while the broad retail pairs have thousands borrowing USDT or BNB against BTCB. The retail pairs carry the directional risk and drove most of the month’s liquidations.
5. Utilization
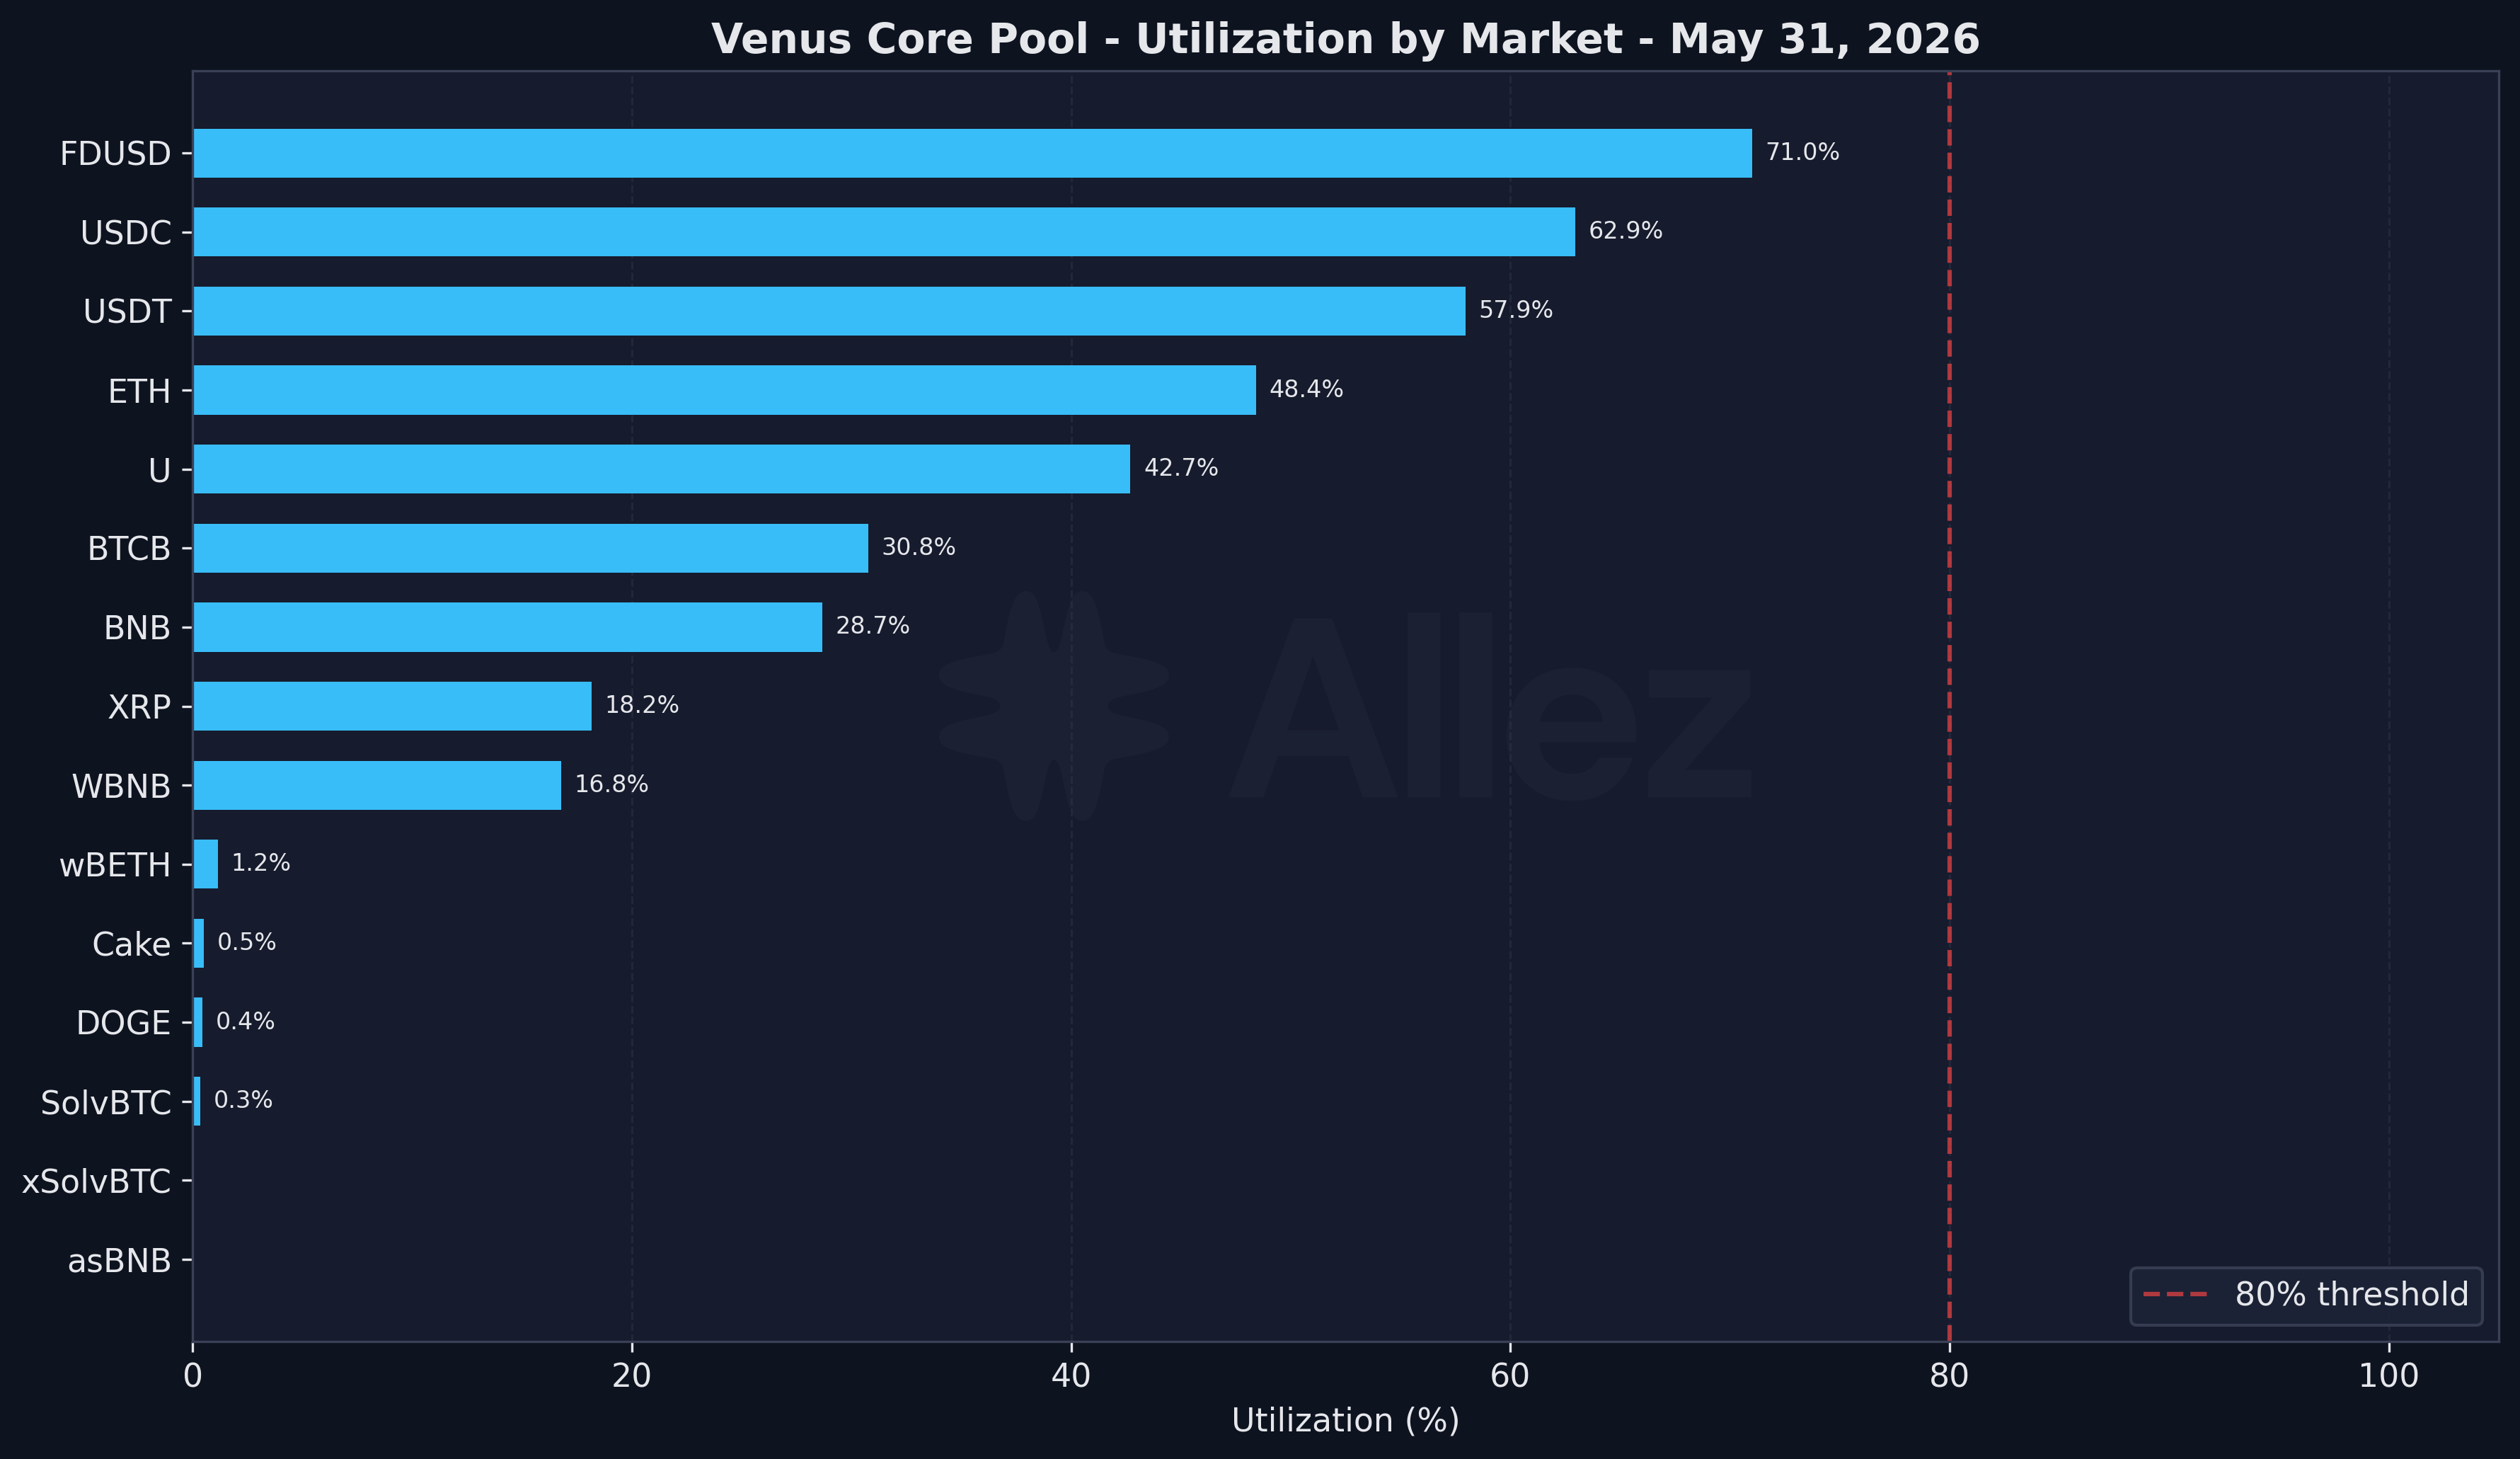
Utilization by Market
Utilization is moderate across the board, with no market near a stress level. The highest are FDUSD at 71.0%, USDC at 62.9%, and USDT at 57.9%, all below the 80% threshold. The notable change is ETH, where utilization fell from 88.3% at the end of April to 48.4%. ETH debt fell 51% ($39.9M to $19.5M) while supply held in token terms, consistent with large ETH borrowing positions opened in April being unwound.
6. Conclusions & Forward Look
May reduced Venus’ exposure to risk overall. ETH debt halved as large April positions unwound, liquidations stayed minimal ($447.5K, no cascade), and uncorrelated debt below a 1.1 health factor fell to $10.9M. Most of the remaining low-health debt is correlated leverage. Governance wound down low utility assets and introduced new safeguards.
Things to watch in June:
- wBETH and ETH stablecoin debt. $4.3M sits within 10% of liquidation, and ETH has been the weakest major collateral. This is the most likely source of new liquidations.
- Stablecoin migration. USDC supply fell 31.7% in May.
- Borrower concentration. The top three borrowers hold $130M, 29% of protocol debt. The main single position is $30.2M of BNB borrowed against BTCB and USDT at a 1.14 health factor, effectively a BNB short that gets squeezed if the rally continues.
Appendix: Asset Category Classification
| Category | Assets | Supply | Debt |
|---|---|---|---|
| BNB | BNB, WBNB, asBNB, slisBNB, PT-clisBNB | $567M | $128M |
| BTC | BTCB, SolvBTC, xSolvBTC | $633M | $122M |
| Stablecoins | USDT, USDC, FDUSD, DAI, U, USD1, TUSD, sUSDe, USDe | $306M | $176M |
| ETH | ETH, wBETH, BETH | $61M | $20M |
| Altcoins | CAKE, XRP, ADA, LTC, LINK, DOGE, others | $56M | $2M |
Correlated positions hold collateral and debt in the same price category (for example SolvBTC against BTCB, or asBNB against BNB) and carry low directional risk. Uncorrelated positions span categories (for example BTCB against USDT) and carry true directional exposure.
Scope: Venus Core Pool on BNB Chain only. Isolated pools and non-BNB deployments are out of scope for this report.
This report represents independent risk analysis by Allez Labs for the Venus community.