Venus Summary Recommendations
- Lower collateral factor of SXP from 35% to 30%.
- Lower collateral factor of TRXOLD from 60% to 50%.
- Raise collateral factor of TRX (new) from 0% to 10%.
- Raise borrow cap of TRX (new) from 100,000 to 200,000.
- Raise supply cap of TRX (new) from 180,000 to 300,000.
- Raise borrow cap of ETH from 28,740 to 40,000 tokens.
Reasoning:
As discussed previously, Gauntlet is providing ongoing deprecation plans for SXP and TRX. Please see the below risk tables for estimated risk off liquidations under current conditions.
Recommended Depreciation Options:
SXP
- Conservative: Lower collateral factor to 32.5%.
- Aggressive: Lower collateral factor to 30.0%.
TRX
- Conservative: Lower collateral factor to 50%.
- Aggressive: Lower collateral factor to 0%.
Our conservative SXP parameter recommendation is an update of our previous recommendation of lowering collateral factor to 35%. Our conservative TRXOLD recommendation corresponds with our previously stated conservative approach of gradually lowering TRXOLD’s collateral factor. Both conservative recommendations for SXP and TRXOLD will not result in major liquidations on Venus and will also allow users to adjust their positions as both markets are phased out.
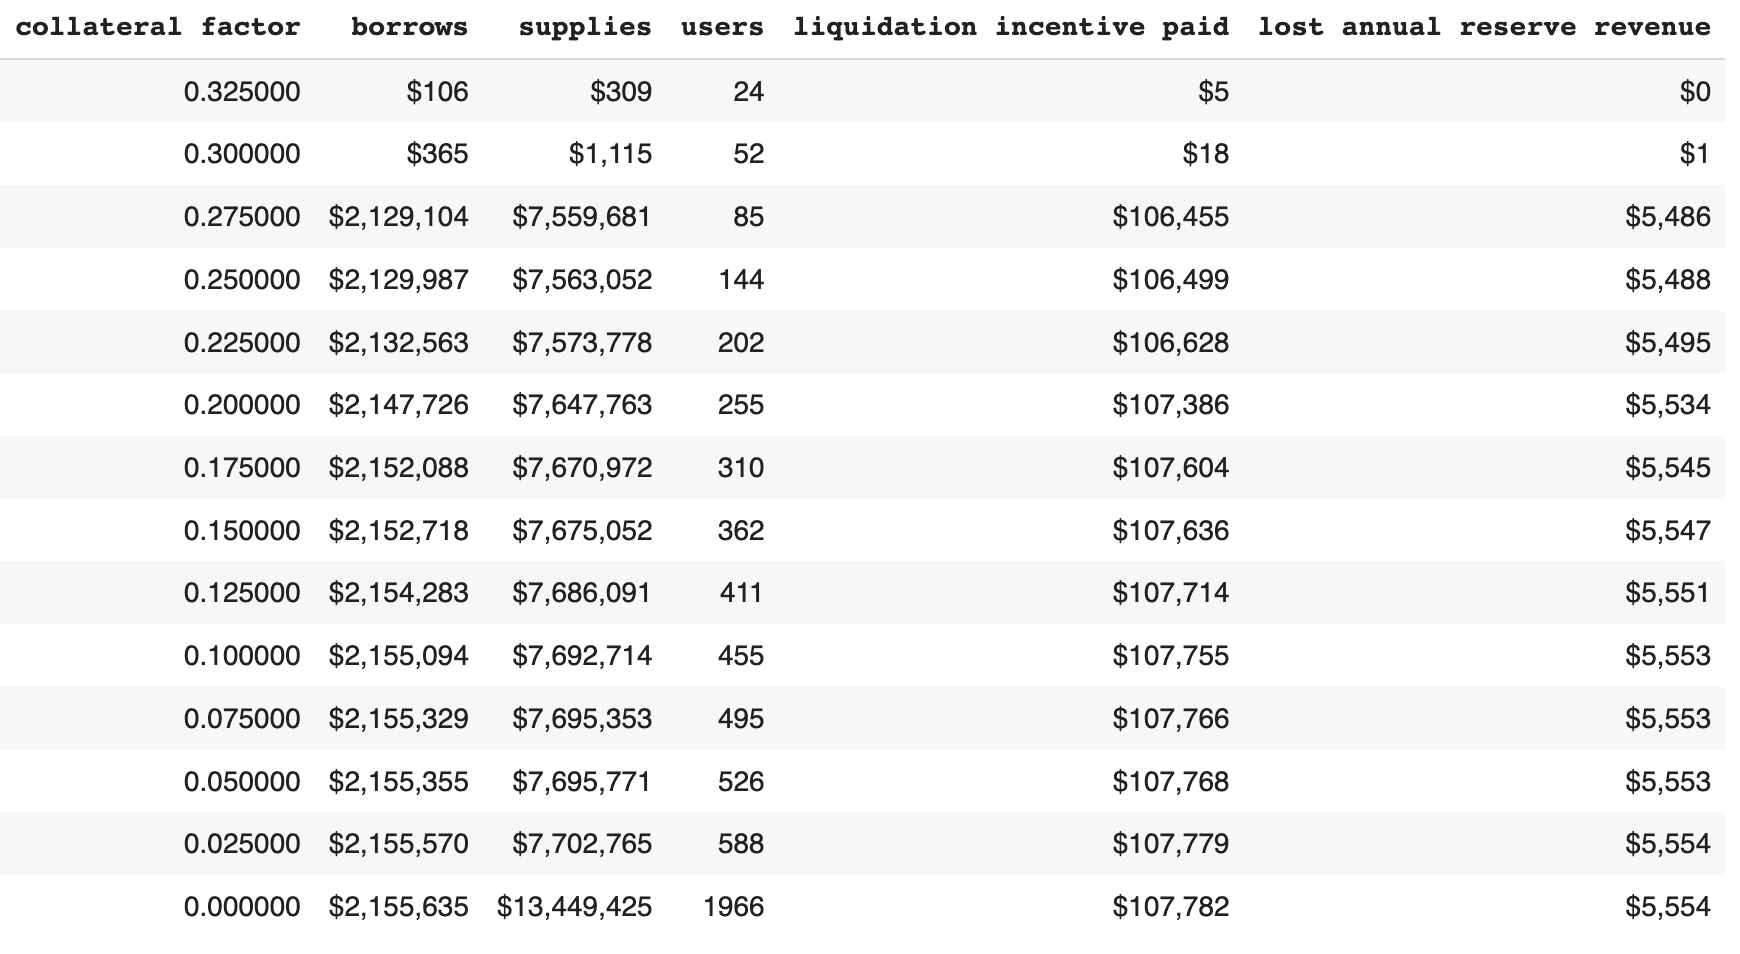
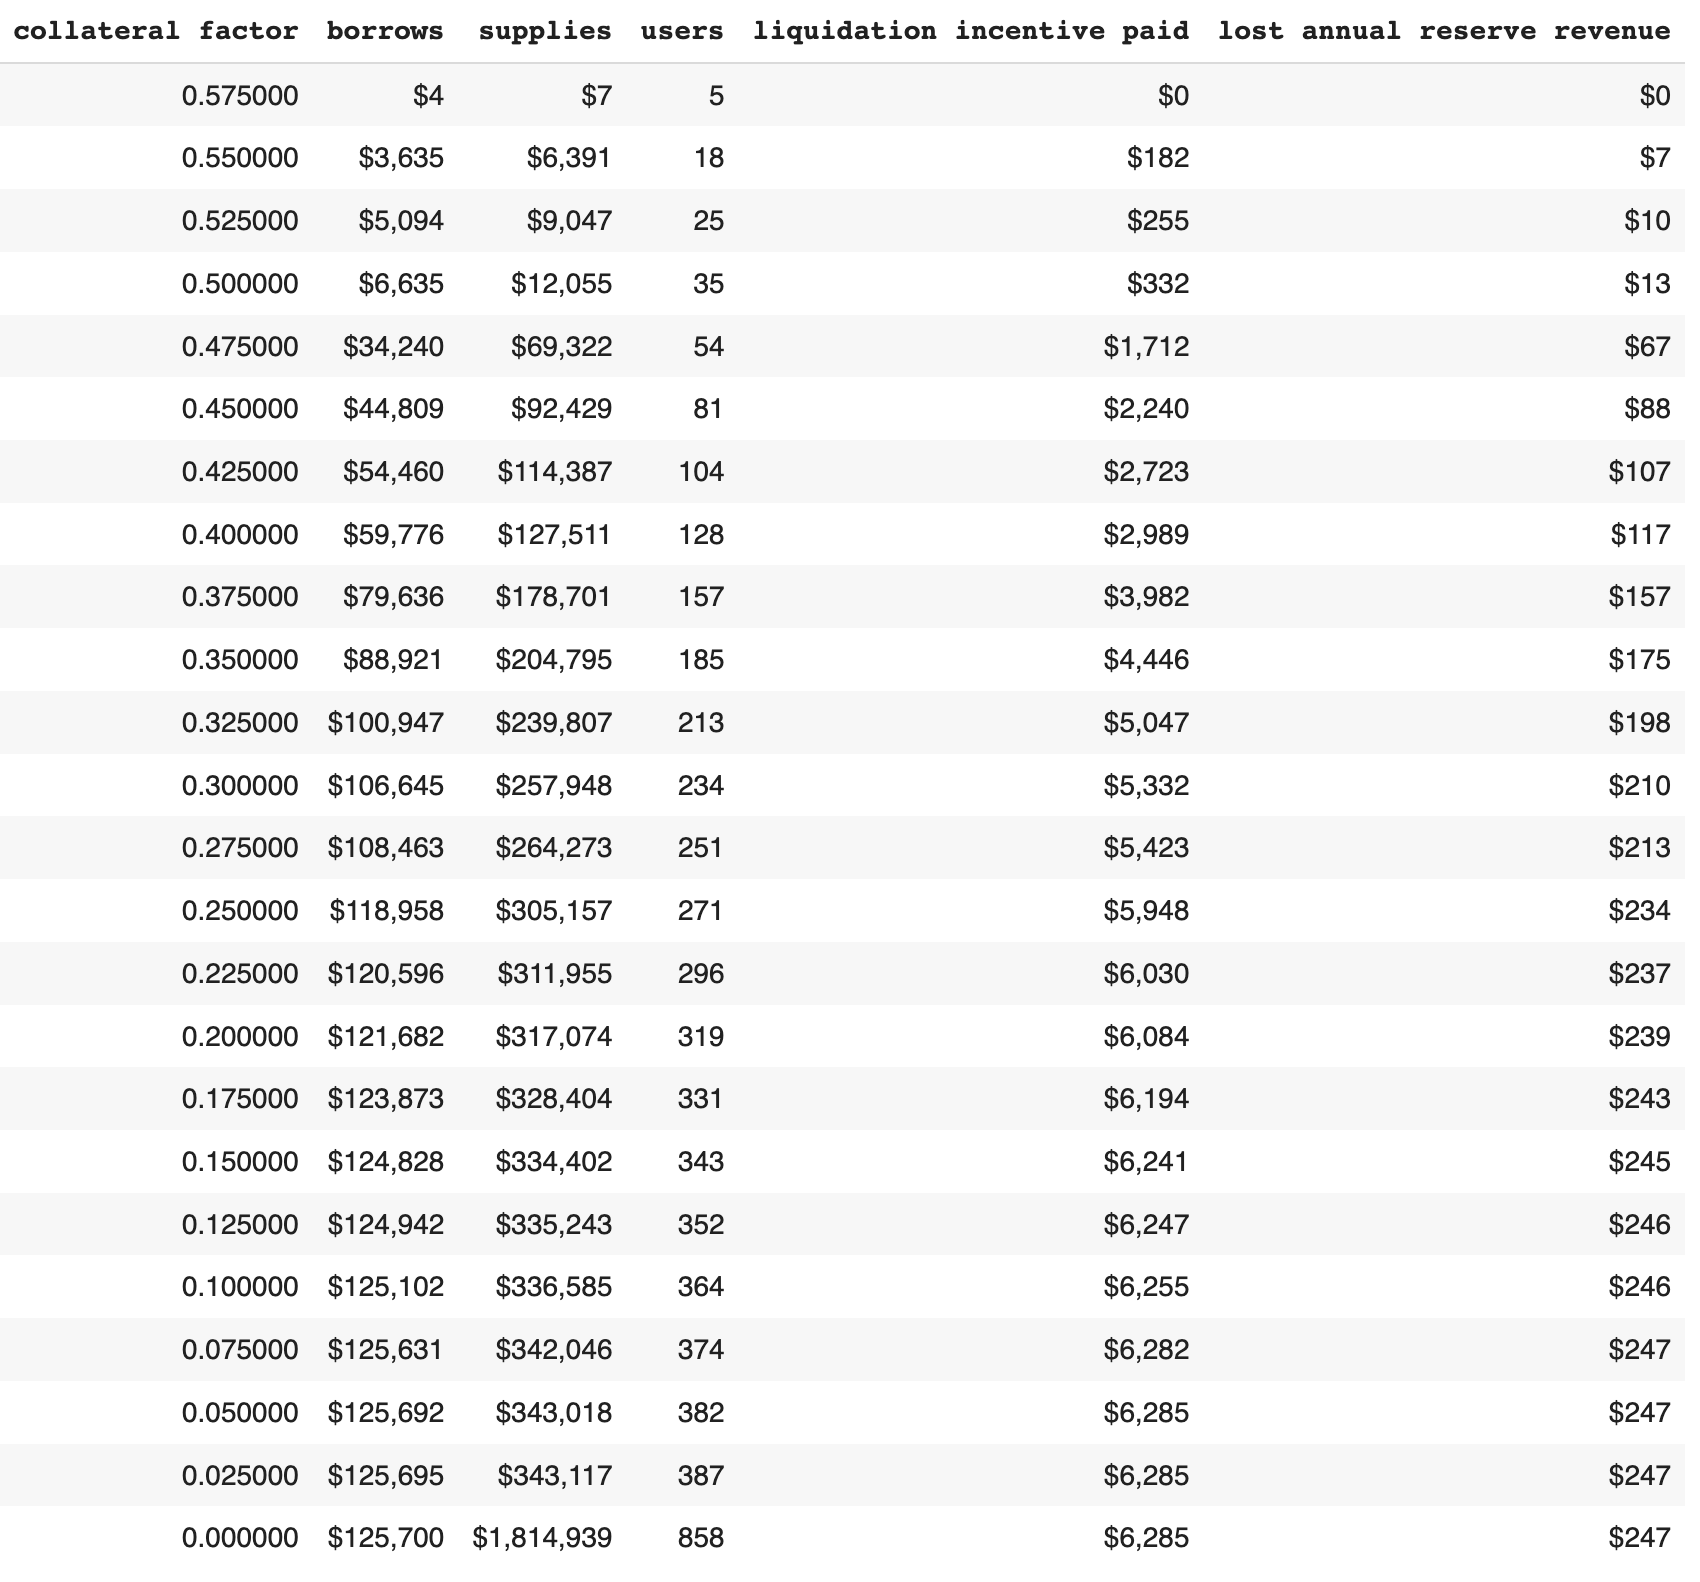
Below we show updated tables of accounts that would be liquidatable under different collateral factors for SXP and TRXOLD. We also list the liquidation incentive paid and lost annual reserve revenues at each collateral factor.
SXP: Estimated Forced Liquidations at Lower Collateral Factors
TRX (OLD): Estimated Forced Liquidations at Lower Collateral Factors
-
Originally, our initial recommendation regarding the new TRX token was to list at 0% until more liquidity develops. Now that the new TRX market is listed and given the conservatism of its initial borrow cap (100,000) and supply cap (180,000) relative to the current circulating supply on Binance chain (~81m tokens), raising the caps slightly likely will not add outsized risk to Venus.
-
ETH’s borrows have nearly reached their borrow caps; a higher borrow cap will provide a better experience for users who wish to borrow ETH and yield more revenue for the protocol without adding outsized market risk.
-
Supporting 11,260 more ETH (or $18,103,715) at an APY of 4.72% and reserve factor of 20% could yield up to $170,900 in additional annual reserve revenue.
Below we provide a broader update on Venus protocol’s risk metrics.
1. Methodology
Gauntlet’s parameter updates seek to maintain the overall risk tolerance of the protocol while making risk trade-offs between specific assets.
Gauntlet’s parameter recommendations are driven by an optimization function that balances 3 core metrics: insolvencies, liquidations, and borrow usage. Parameter recommendations seek to optimize for this objective function. Our agent-based simulations use a wide array of varied input data that changes daily (including but not limited to asset volatility, asset correlation, asset collateral usage, DEX / CEX liquidity, trading volume, expected market impact of trades, and liquidator behavior). Gauntlet’s simulations tease out complex relationships between these inputs that cannot be simply expressed as heuristics. As such, the input metrics we show below can help explain why some of the param recs have been made but should not be taken as the only reason for the recommendation. The individual collateral pages on the Venus Risk Dashboard cover other vital statistics and outputs from our simulations that can help with understanding interesting inputs and results related to our simulations.
For more details, please see Gauntlet’s Parameter Recommendation Methodology and Gauntlet’s Model Methodology.
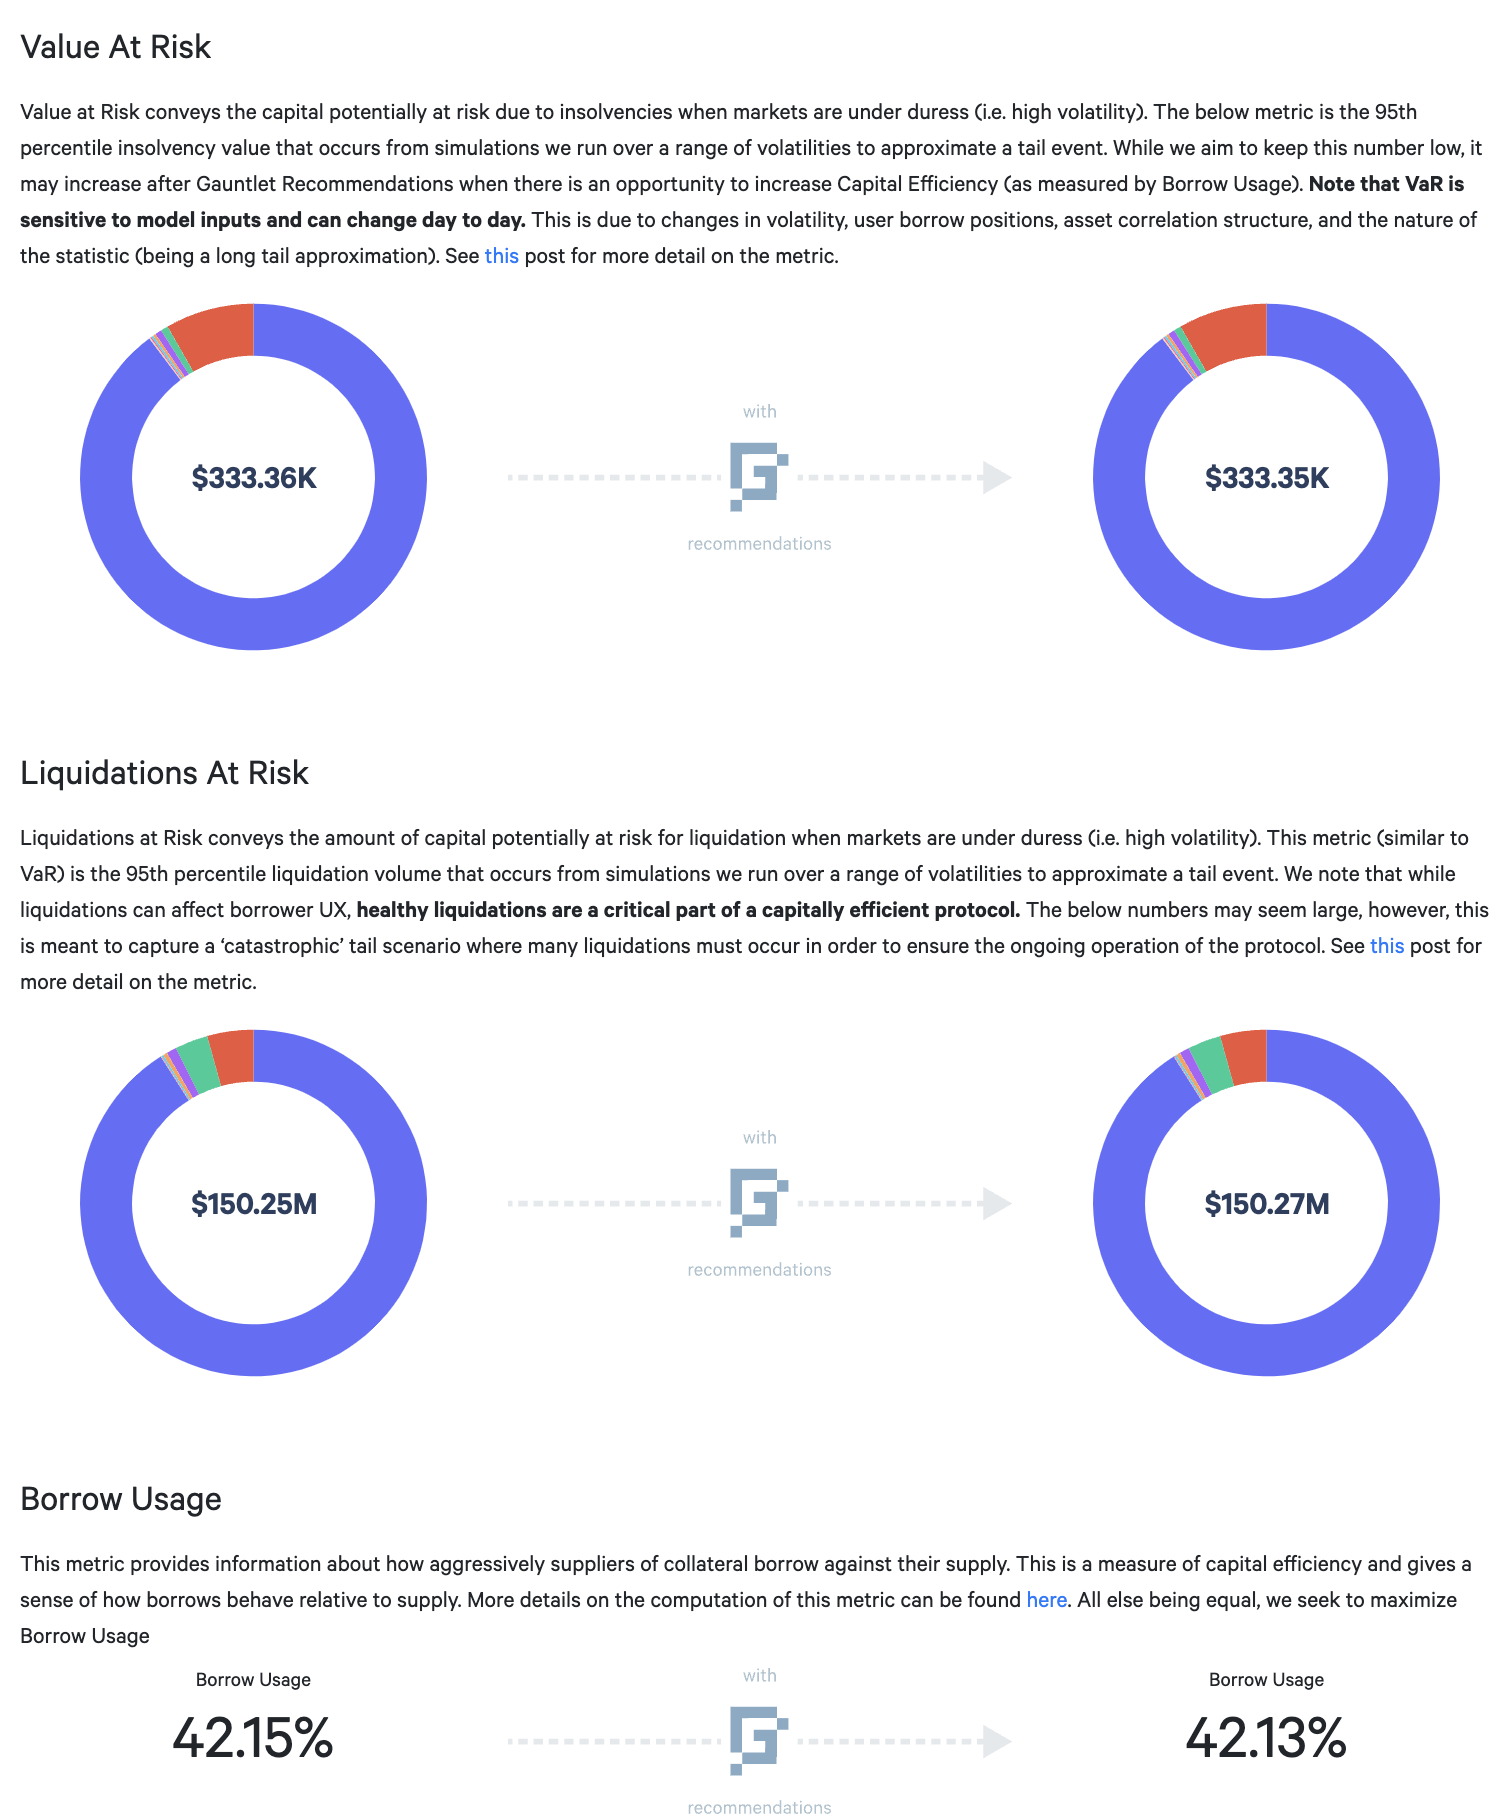
2. Risk Dashboard
The community should use Gauntlet’s Venus Risk Dashboard to better understand any updated parameter suggestions and general market risk in Venus. Value at Risk represents the 95th percentile insolvency value that occurs from simulations we run over a range of volatilities to approximate a tail event. Liquidations at Risk represents the 95th percentile liquidation volume that occurs from simulations we run over a range of volatilities to approximate a tail event. We would note that our methodology on borrow/supply caps currently is driven by risk modeling that is independent and additive to the our risk simulations shown on the Dashboard.
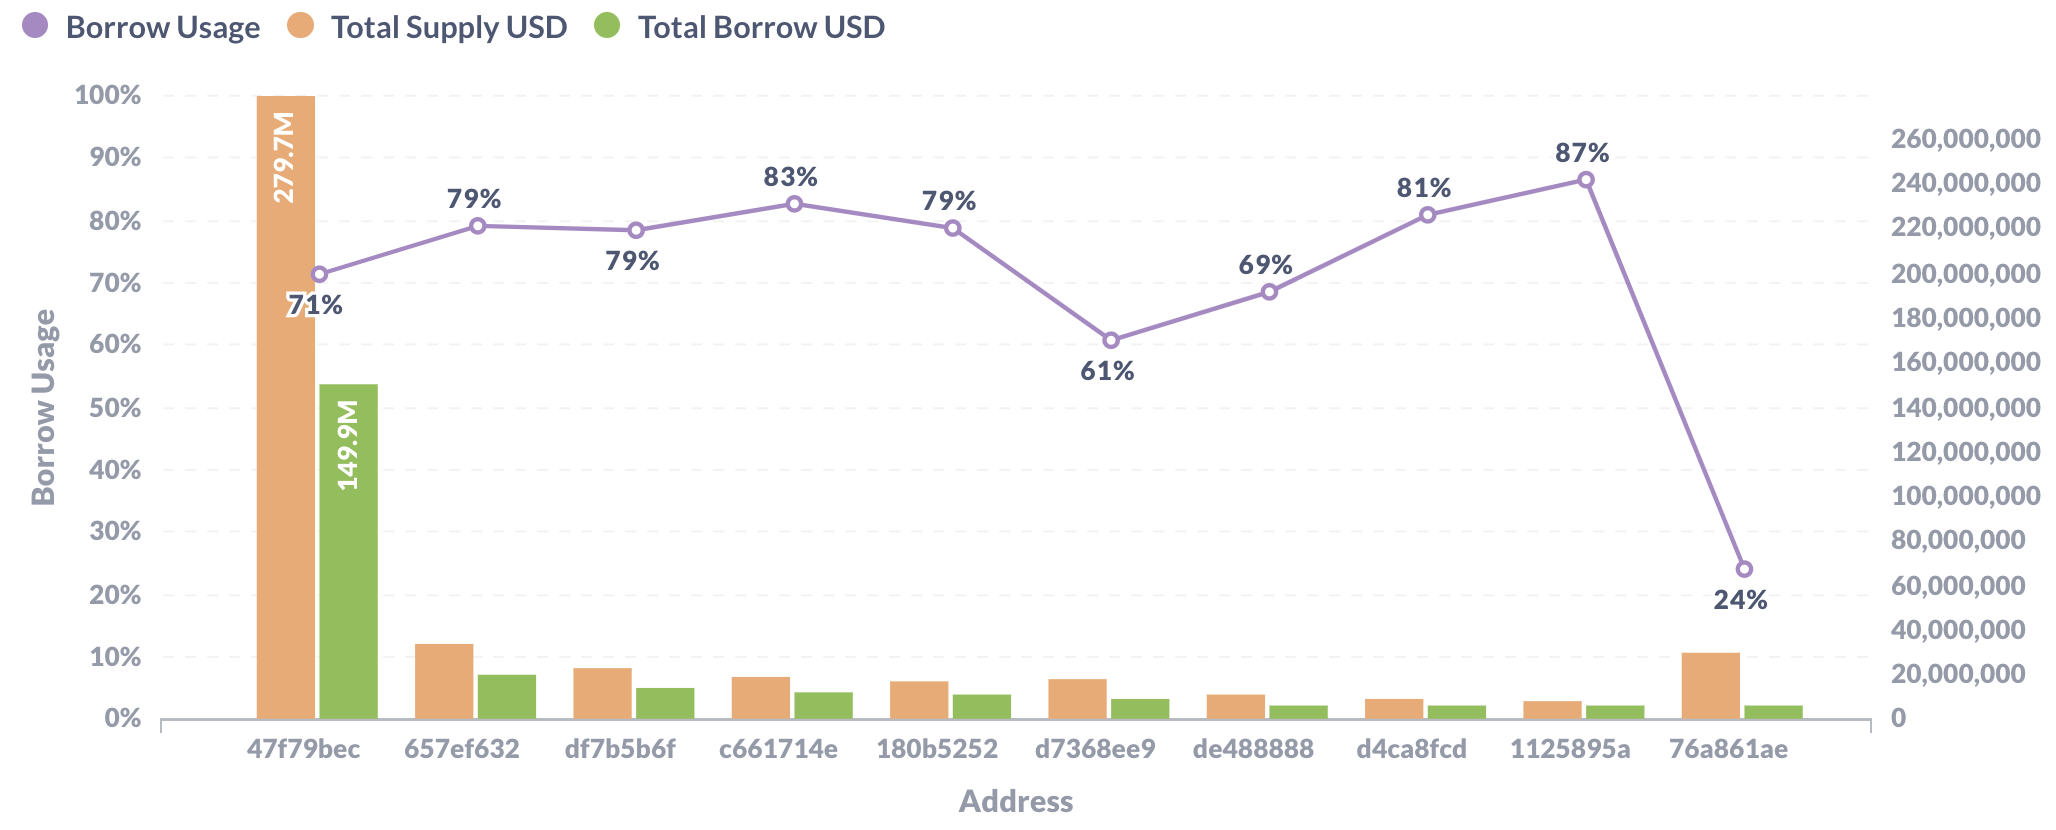
3. Top Borrowers
The below figures show trends in key market statistics regarding borrows and utilization that we will continue to monitor:
Top 10 Borrowers’ Aggregate Positions & Borrow Usages
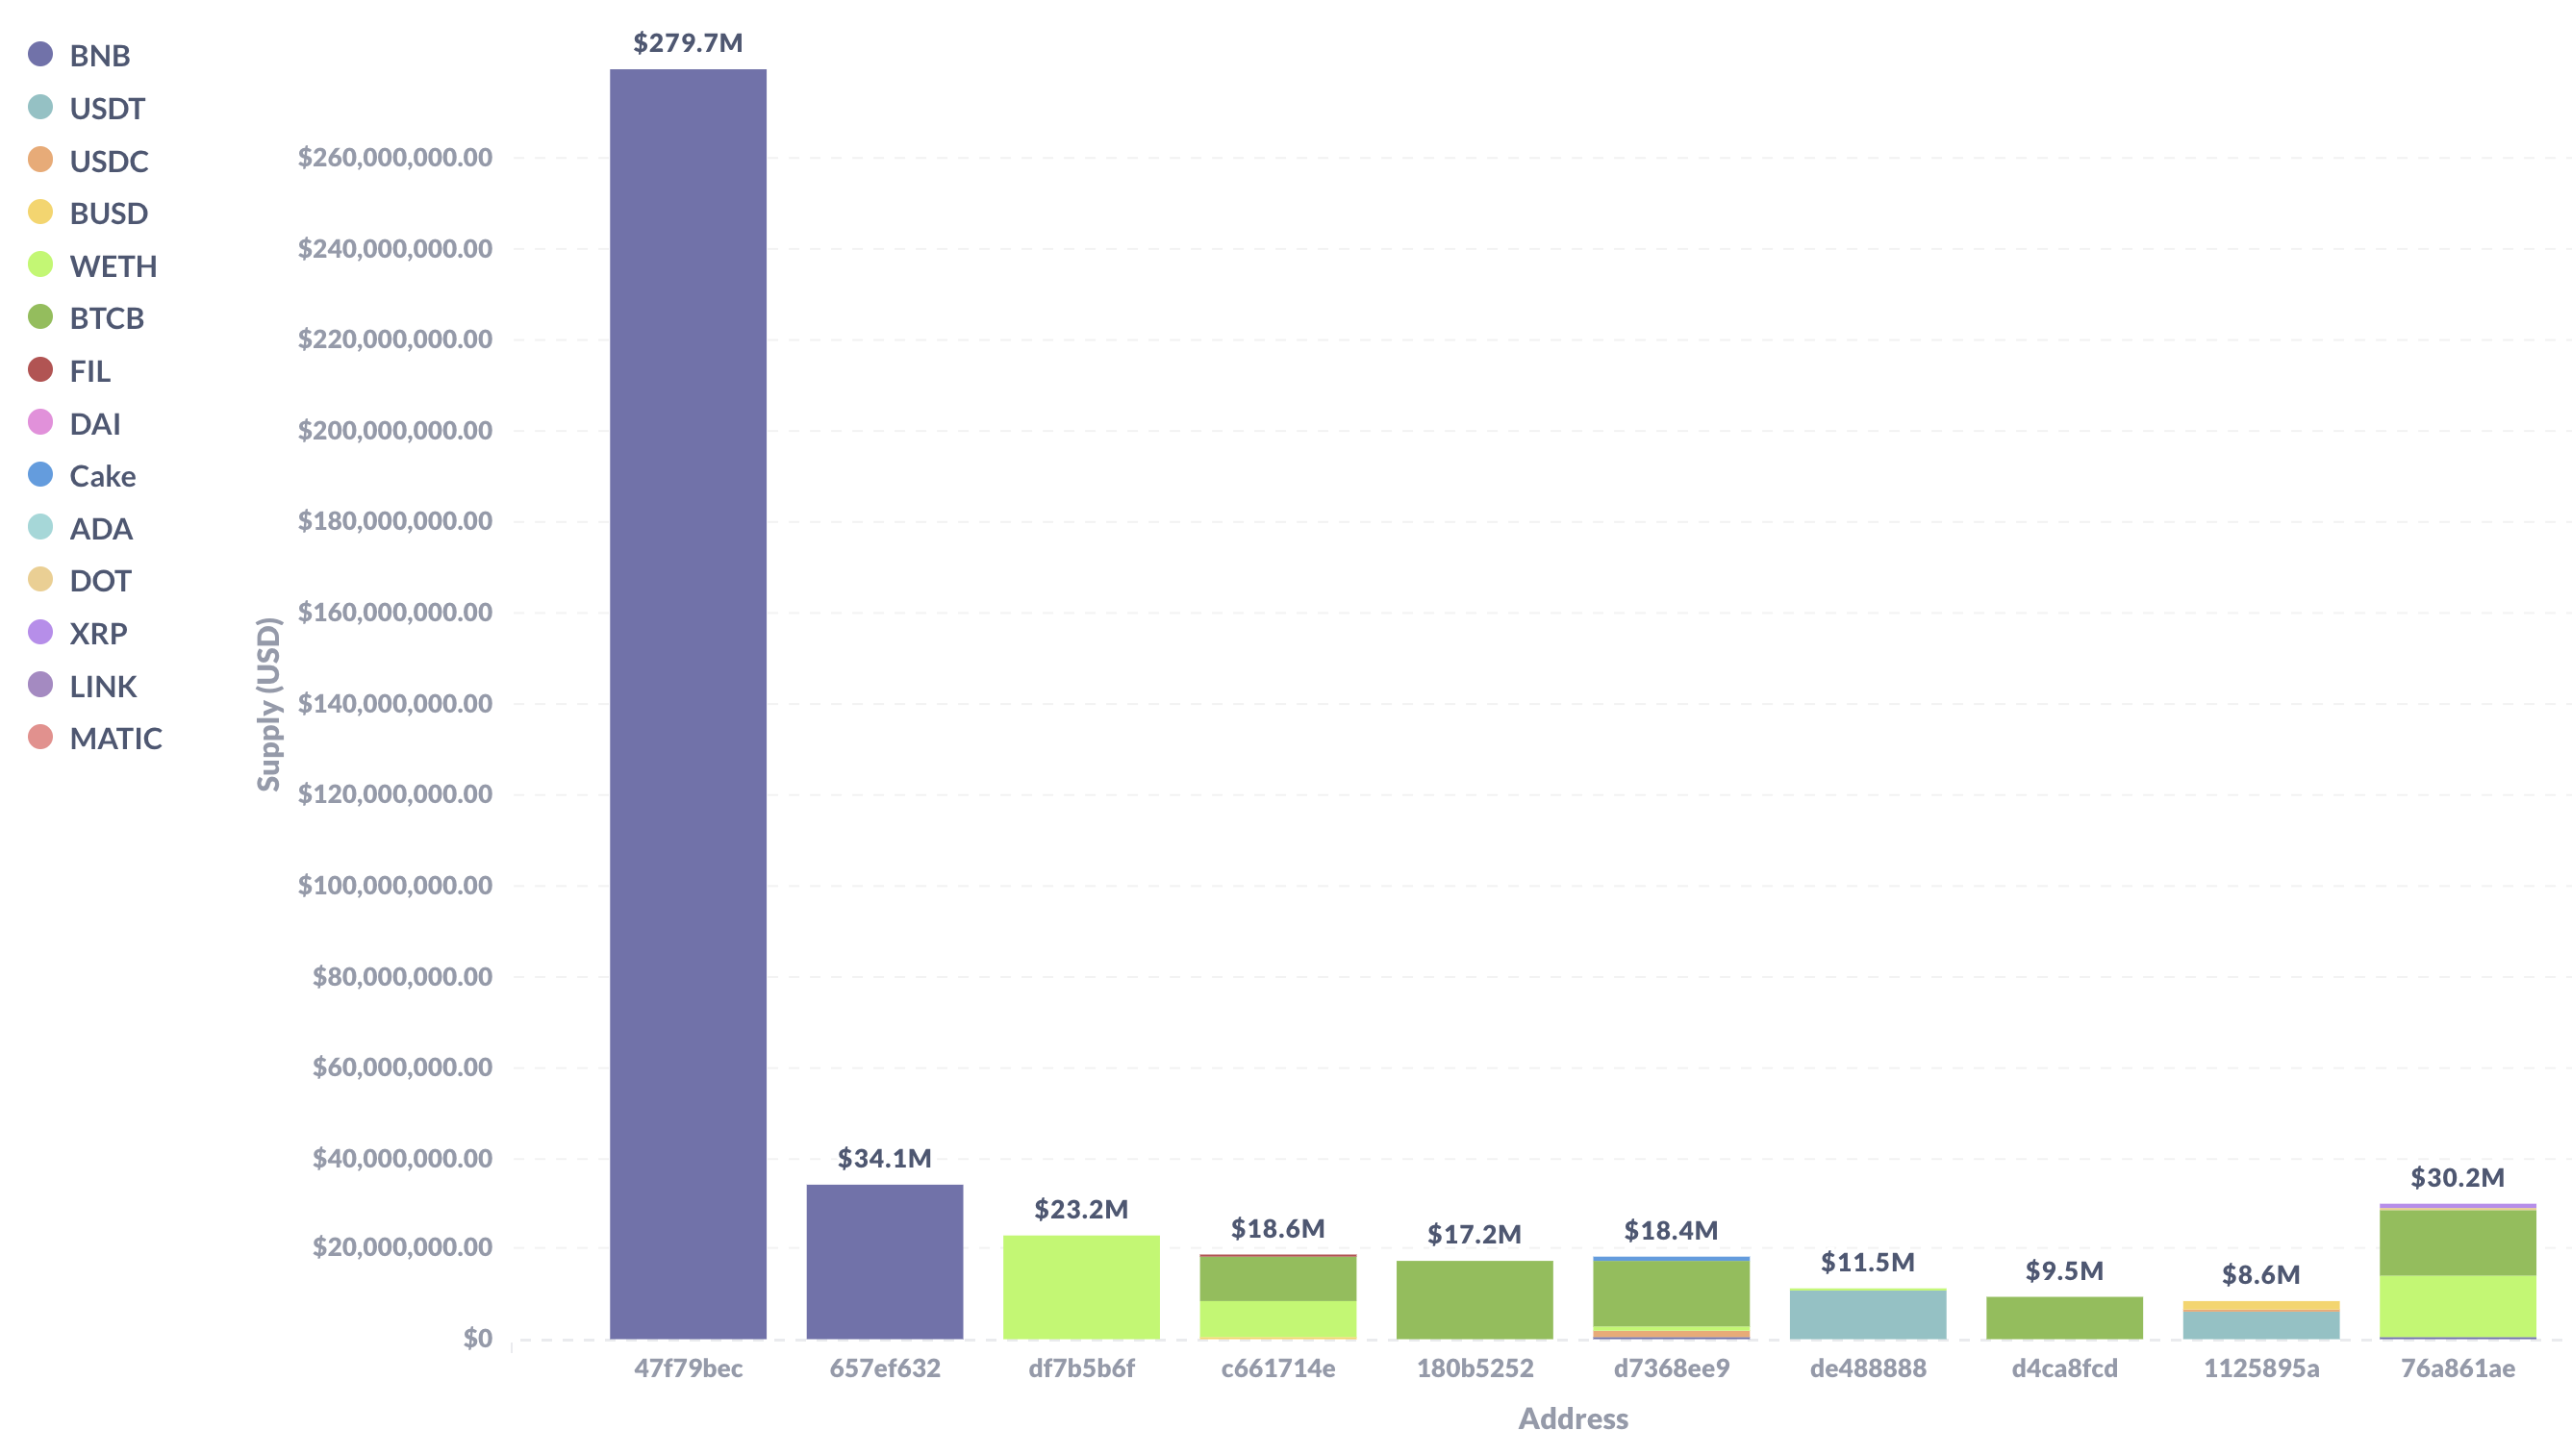
Top 10 Borrowers’ Entire Supply
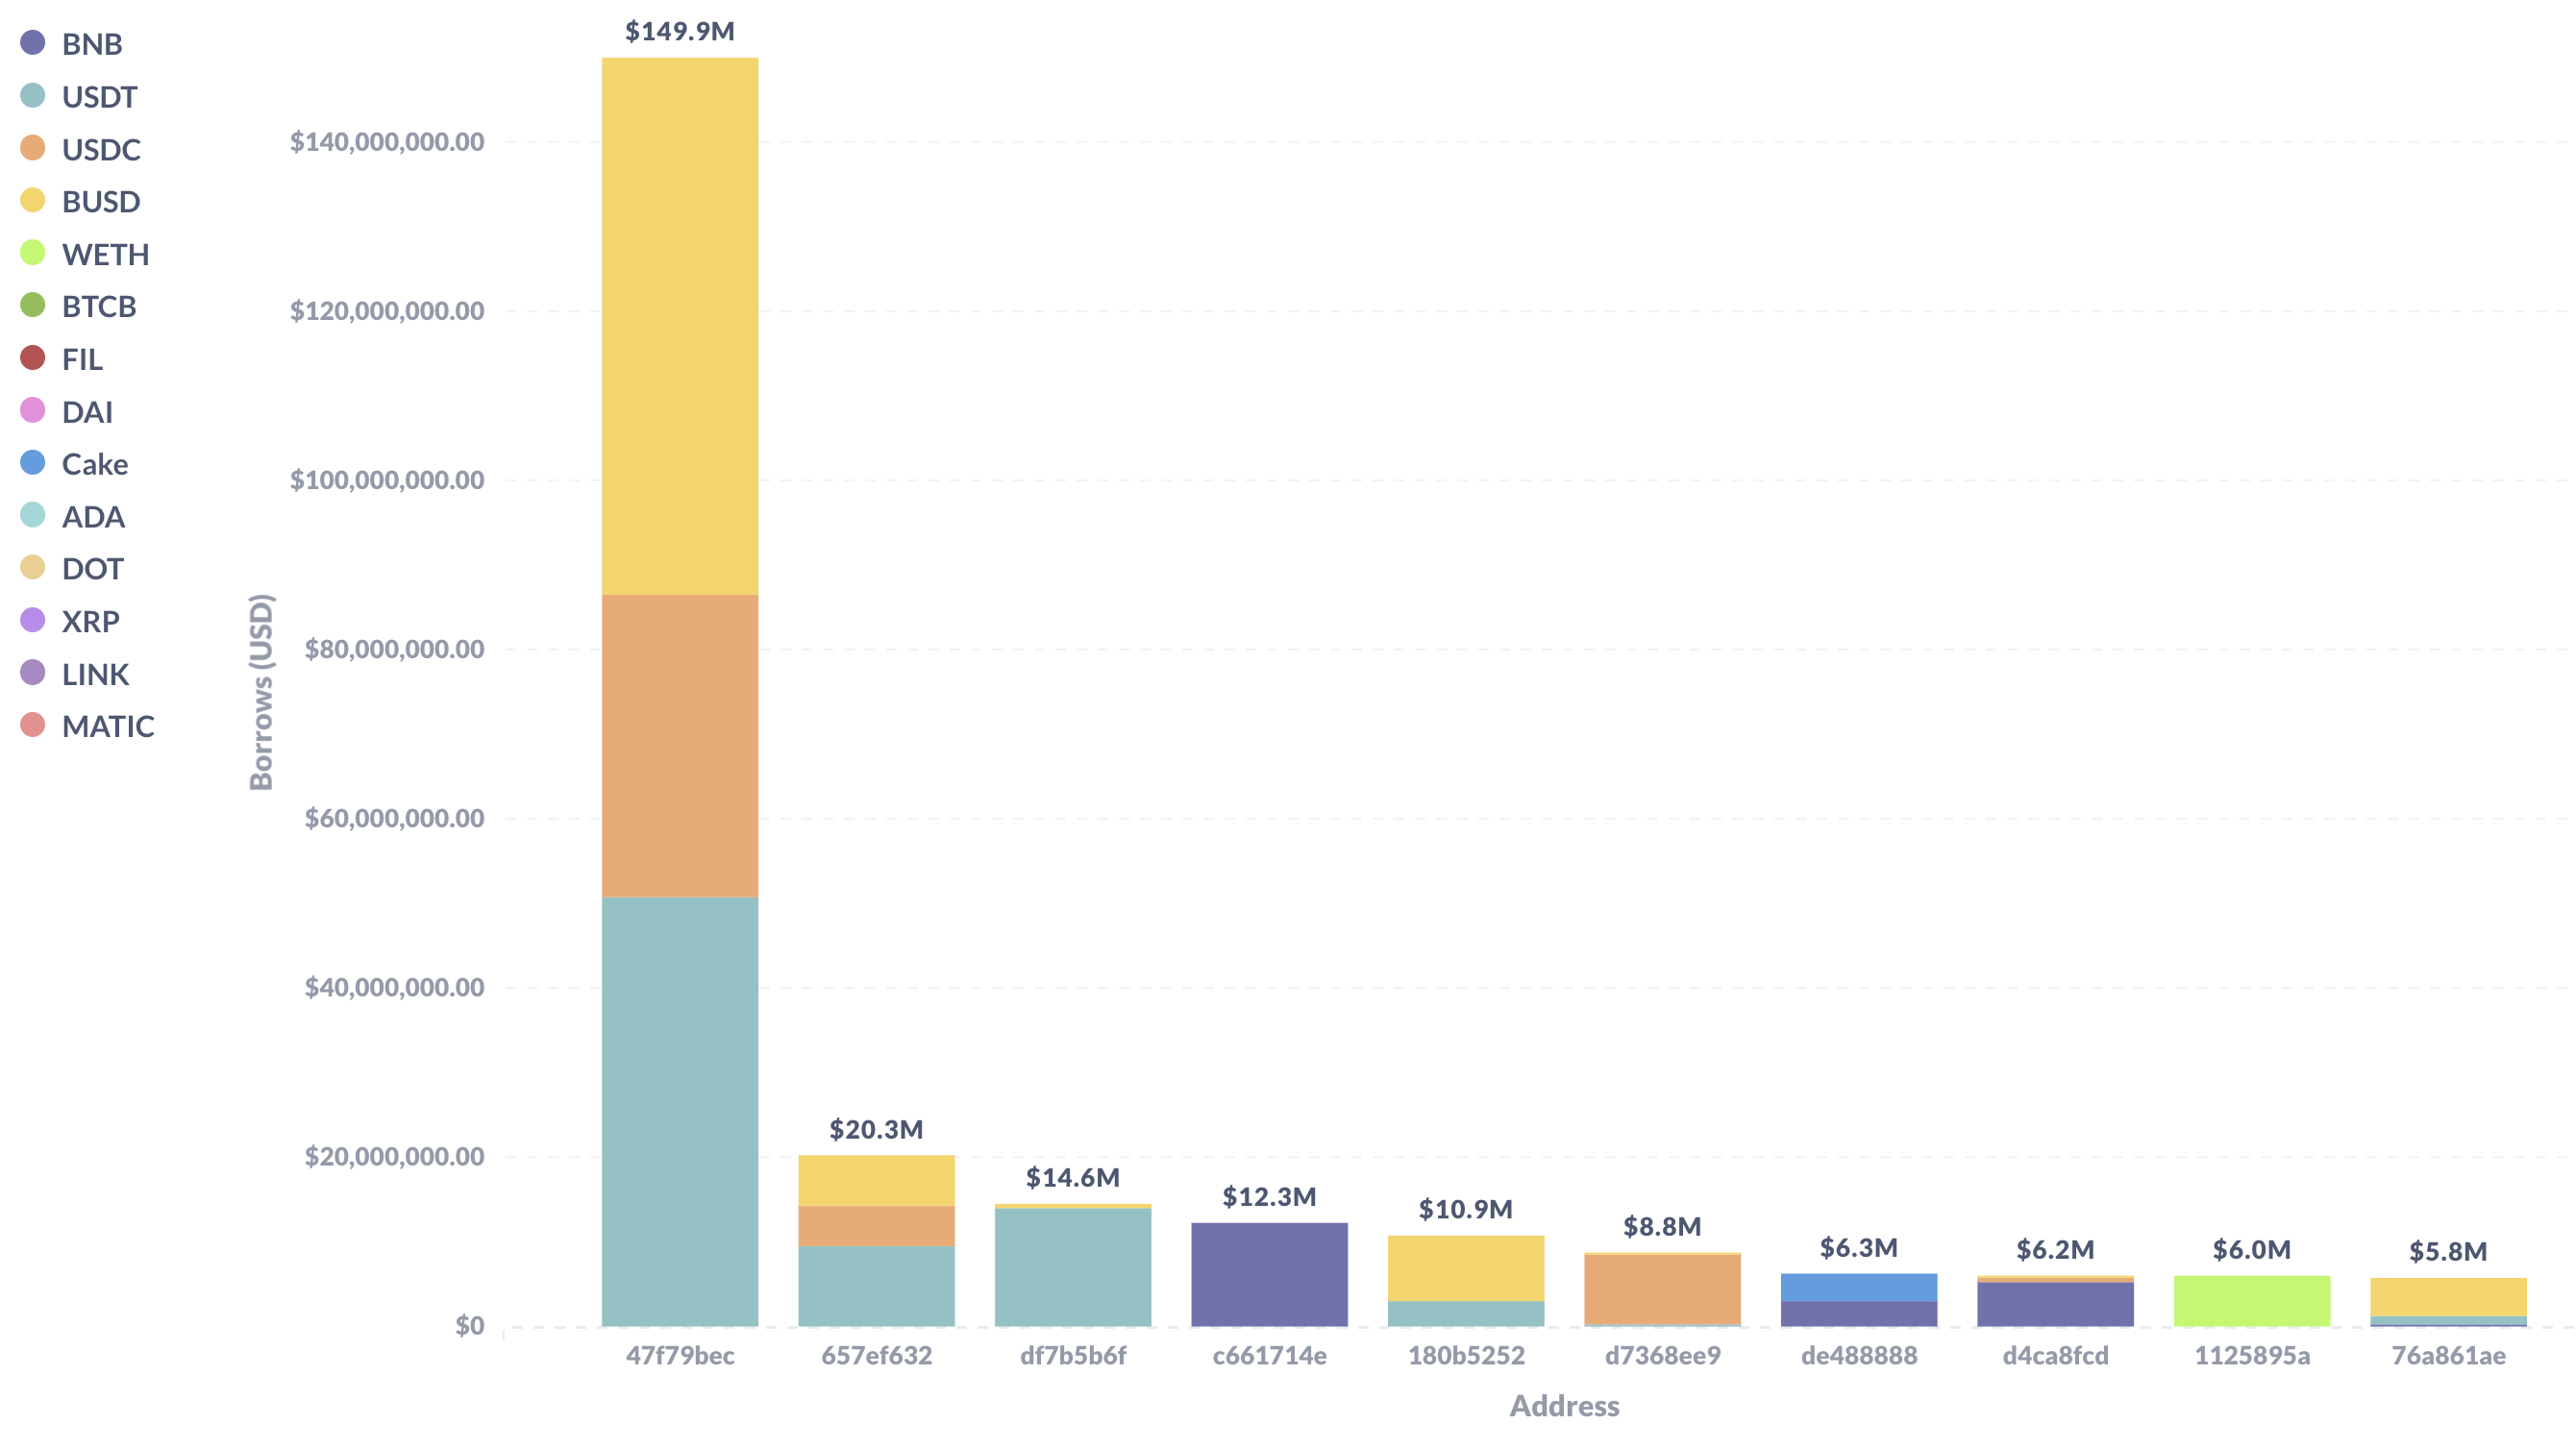
Top 10 Borrowers’ Entire Borrows
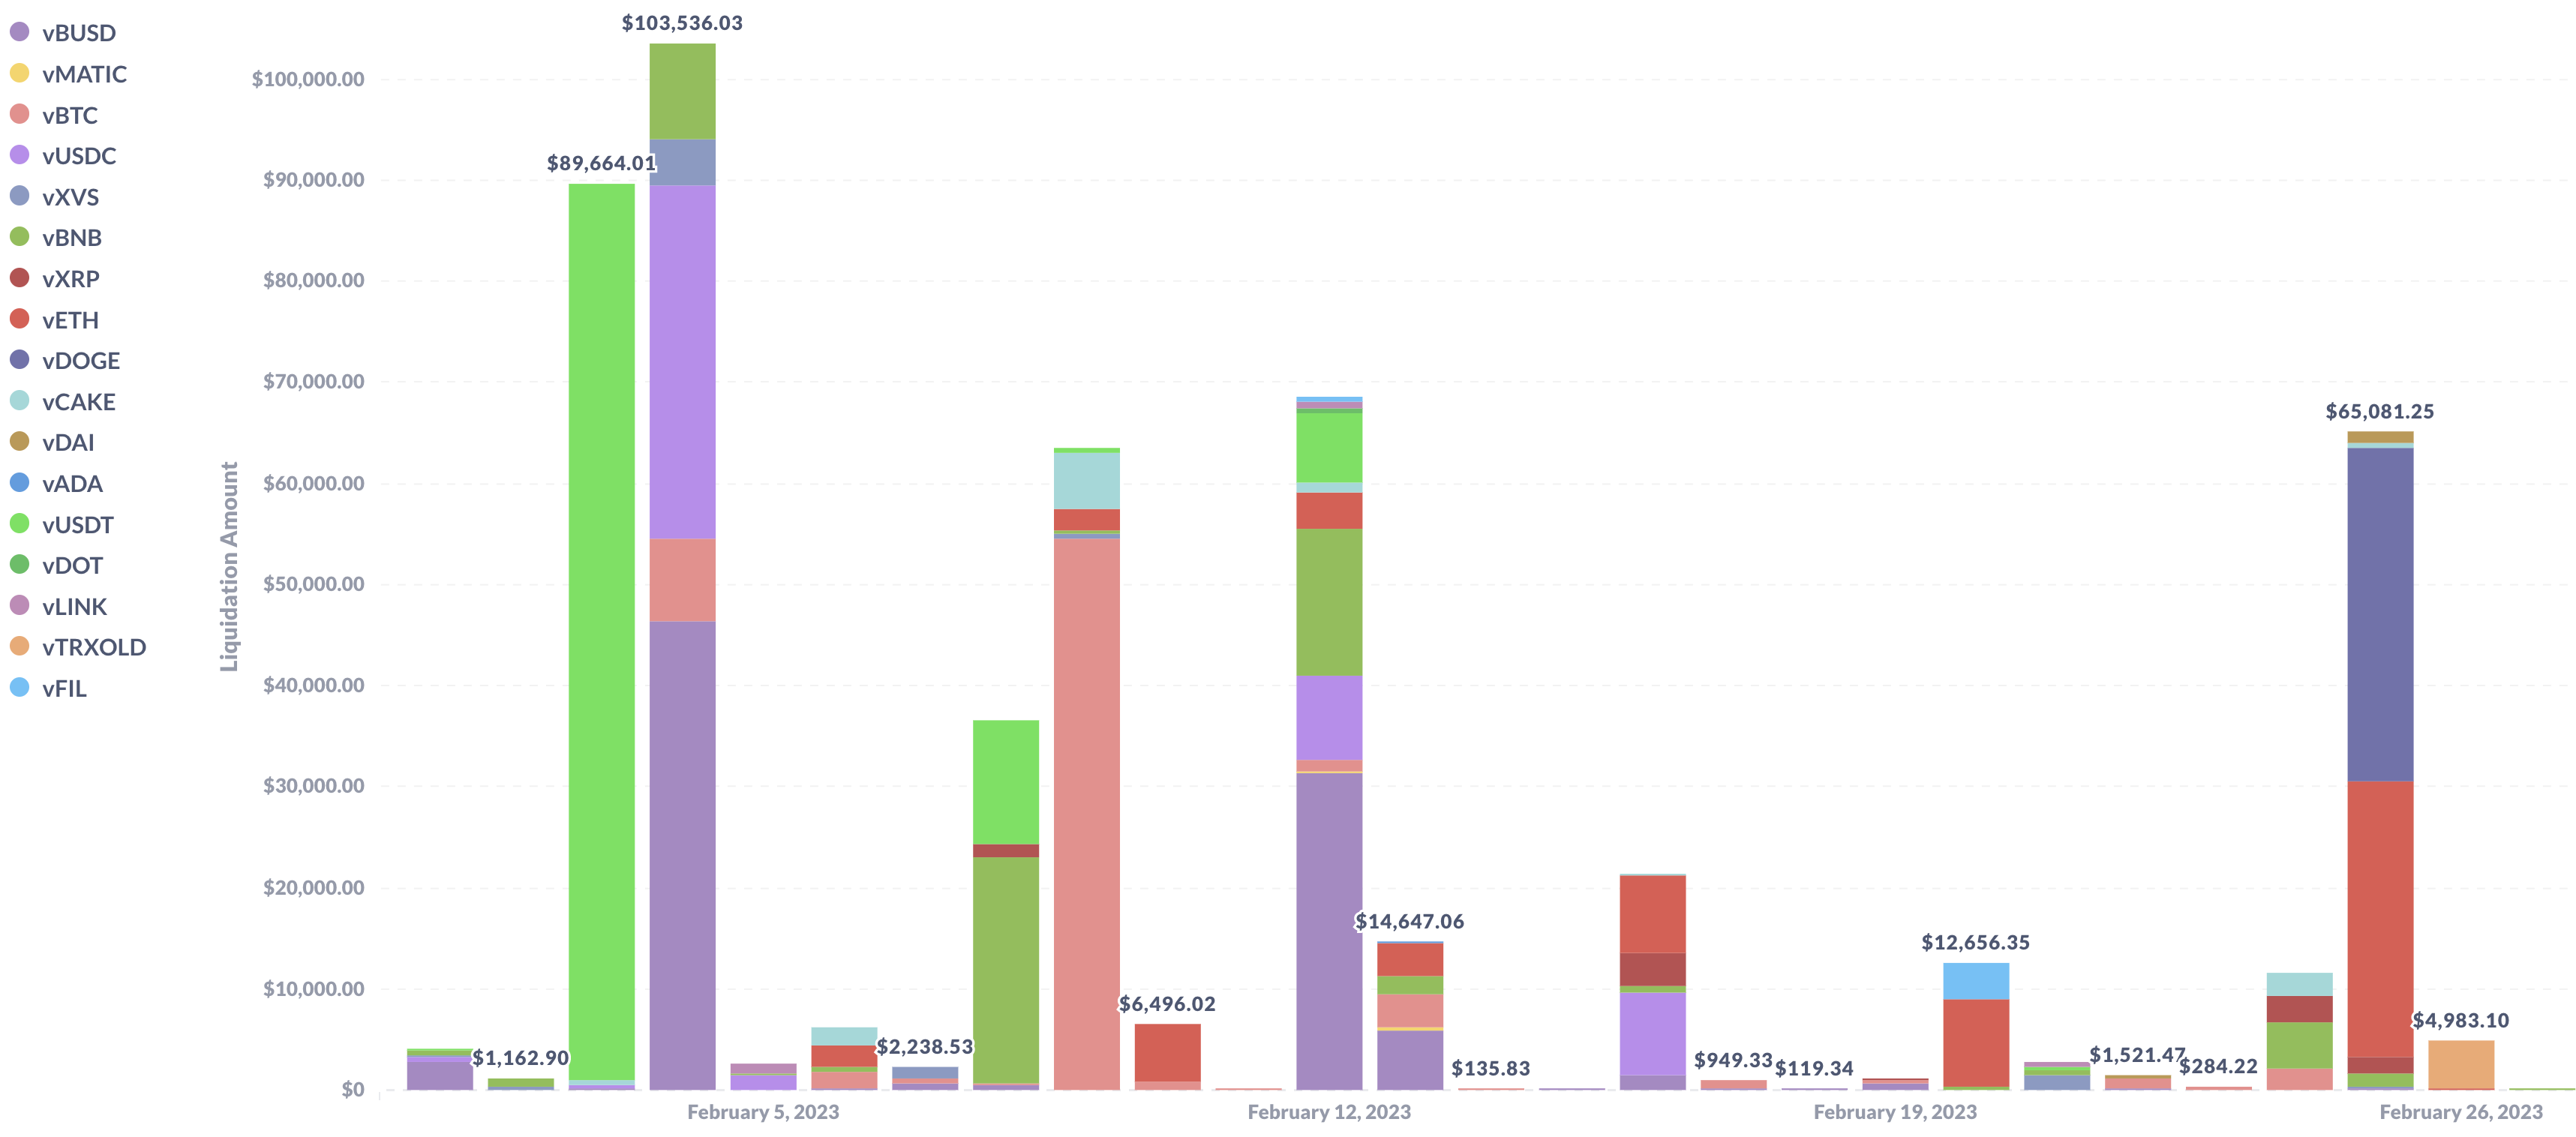
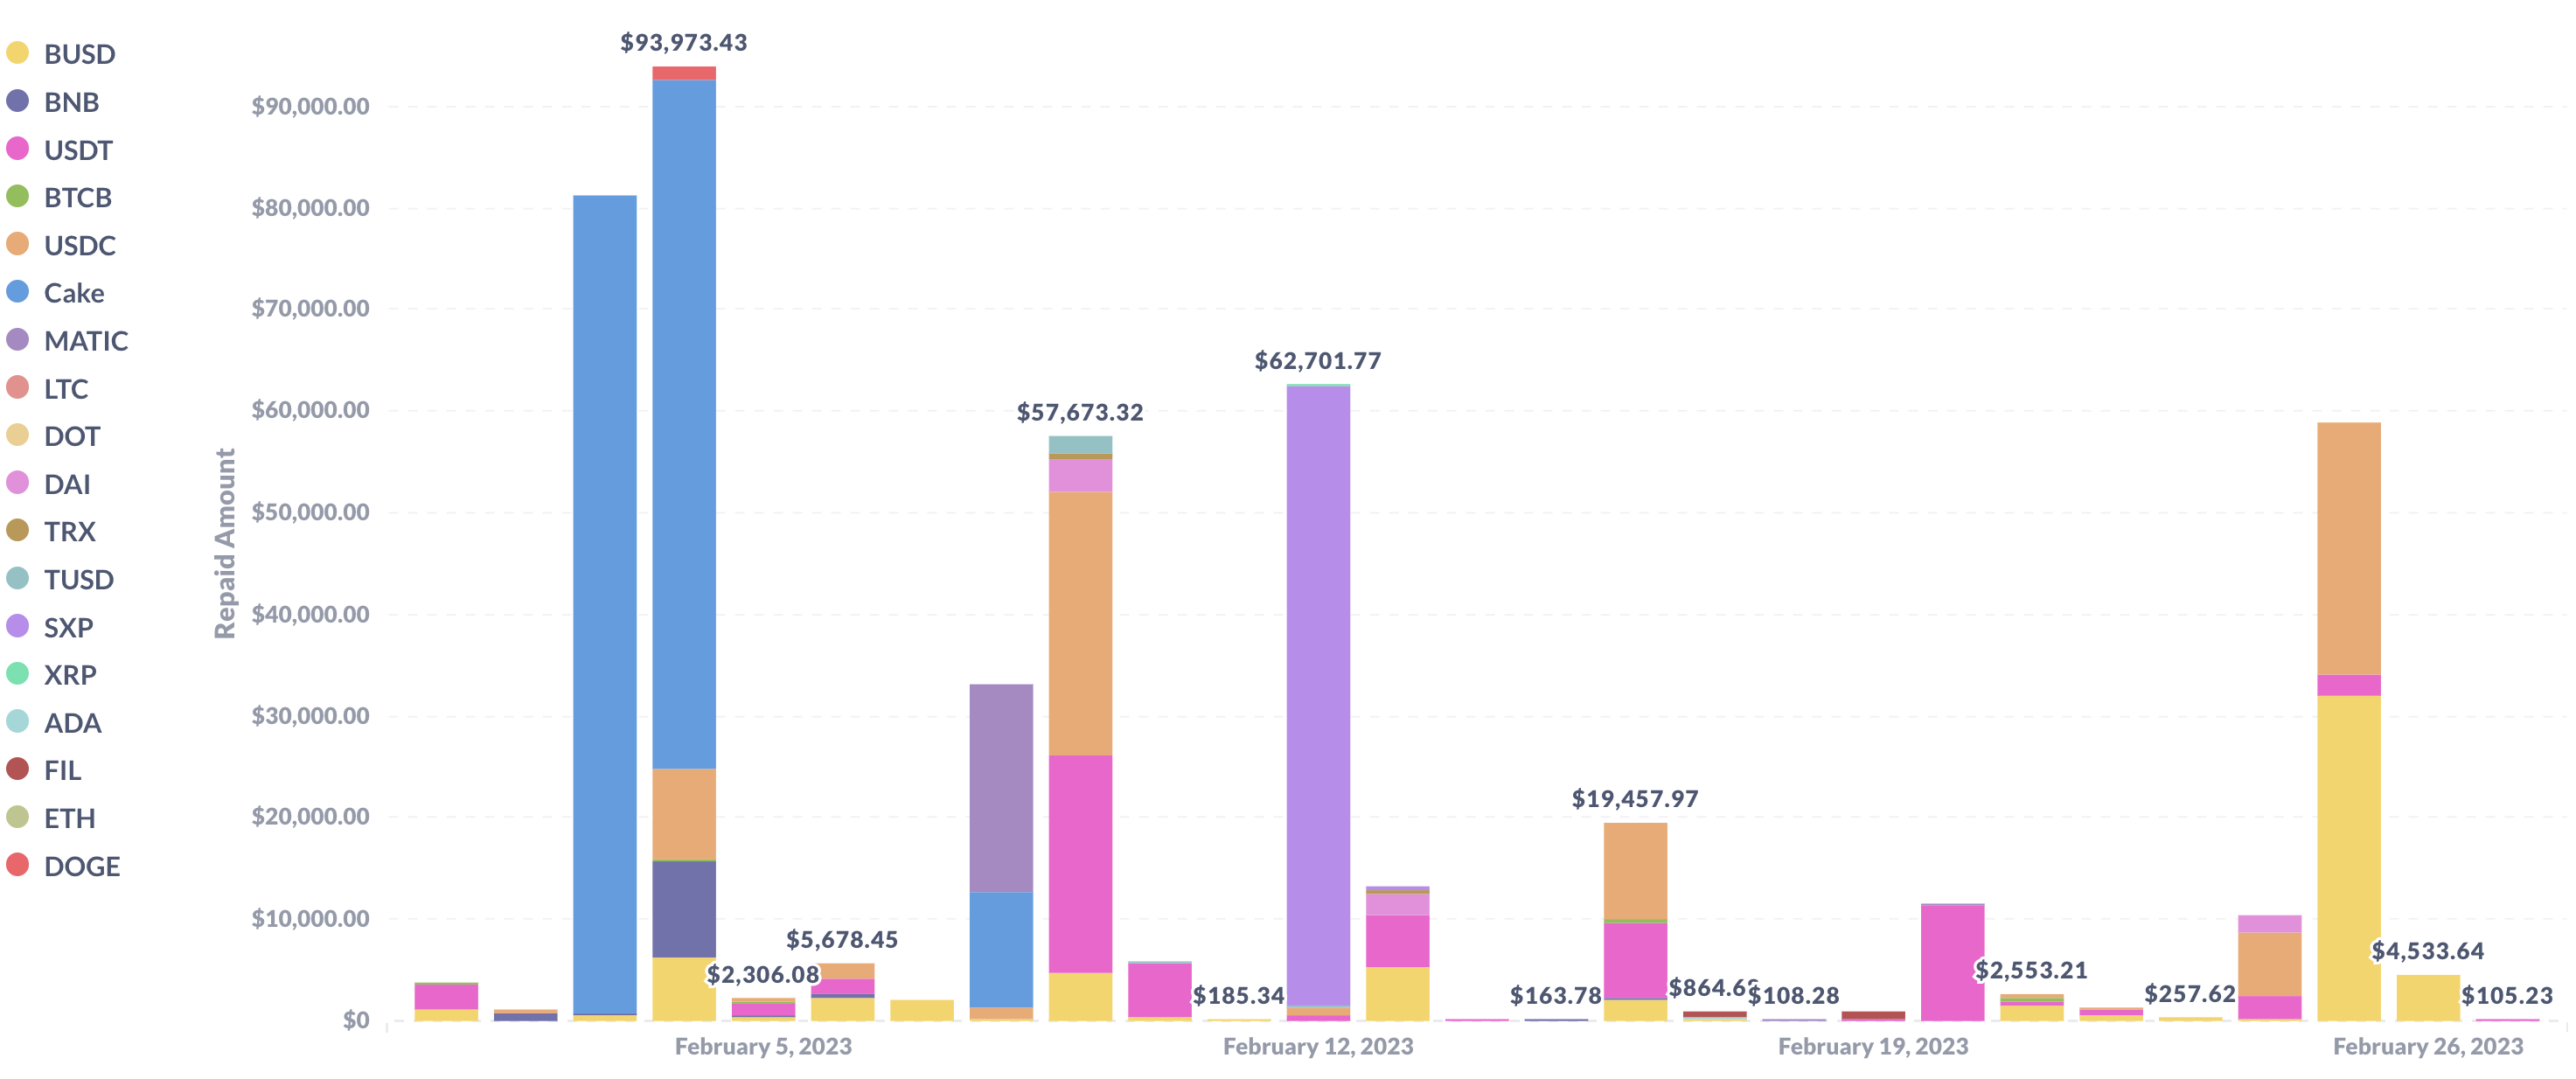
4. Liquidations
As Gauntlet tracks the state of the market and protocol, below shows some of the behavior we have been monitoring to ensure minimal market risk.
- Between February 3-4, the price of CAKE rose 11.1%, likely explaining the liquidations of borrowed CAKE tokens on those dates totaling $148.2k.
- On February 9, the price of vBTC fell 2.9%, causing a liquidation of an account supplying $54.6k of that token.
- On February 12, the price of SXP spiked ~25%, causing liquidations of around $60.9k of SXP borrows.
We will continue to monitor user and protocol positions and make recommendations as needed.
Helpful Quick Links
Please click below to learn about our methodologies:
Next Steps
- These recommendations will be put up for a VIP vote
By approving this proposal, you agree that any services provided by Gauntlet shall be governed by the terms of service available at gauntlet.network/tos.