Hi everyone, this is Marcin from RedStone. Below is our analysis of the dual-vendor OEV trial on Venus Protocol, covering the official evaluation period confirmed by the Venus core team from February 7 to May 7, 2026. Rather than declaring a winner from a three-month sample, we want to present a framework for evaluating OEV performance that the community can assess on the merits, and recommend a path forward that serves the protocol’s long-term resilience and OEV capture.
Background
RedStone has been a core oracle partner to Venus for the past three years. Following the 2022 Luna oracle event, which exposed single-provider risk and resulted in an $11M bad debt incident, Venus rearchitected its oracle stack around the ResilientOracle module. RedStone has been a core contributor to that work, building and hardening it alongside the Venus team through multiple market cycles.
Over those three years, RedStone has supported Venus’s expansion on BNB Chain across new collateral assets and methodologies, and across new chains the protocol has deployed to. Throughout the OEV evaluation period, specifically, operational reliability was uninterrupted: all price configuration requests were fulfilled without disruption, and RedStone-secured Venus markets recorded zero security incidents and zero bad debt.
Since its launch, Atom has shown a strong track record, operating across multiple lending protocols, including Hyperlend, Morpho, and Felix, with strong endorsement from those teams, and additional deployments are in progress. Below, we present the results of the trial period and our recommendations on how to interpret the key metrics.
Measuring OEV Performance For The Long Run
Choosing what to measure matters. Liquidation value is extremely fat-tailed: a small number of events in any period can account for the majority of total dollar volume. This means dollar-weighted metrics over short windows are sensitive to which specific events happened to fall within that window. We will return to this.
We believe a complete evaluation needs at least two metrics.
Metric 1: OEV Recapture Efficiency - The Compounding Effect
Of the metrics in this evaluation, recapture efficiency is the one that scales over time. It measures how much of the available value is returned to the protocol on every liquidation the system wins, and it applies to every future OEV event for as long as the integration runs. A gap here is a multiplier on every dollar of liquidation value Venus generates for years to come.
Venus retains a fixed 5% treasury fee on every liquidation. This accrues to the protocol regardless of any OEV activity and is not solver-recapturable value. What remains after subtracting that fee from the gross bonus is the maximum a solver could theoretically bid back. We call this the recapturable bonus.
The formulas:
Gross Bonus = Collateral Seized - Debt Repaid
Treasury Take = 0.05 × Debt Repaid
Recapturable Bonus = Gross Bonus - Treasury Take
Recapture Efficiency = OEV Bid / Recapturable Bonus
Dollar-Weighted OEV/Collateral Ratio = Σ OEV Bid / Σ Collateral Seized
This is computed per liquidation and averaged across all captured transactions, weighted by collateral size.
Why this matters: high recapture efficiency means value is not leaking between what is available and what is returned to the protocol. Low efficiency means that the gap is large, regardless of how much liquidation volume flows through the system.
Over the trial period, RedStone’s recapture efficiency was 78.36%. Chainlink’s figure was 50.7%. On the liquidations each provider won, RedStone returned substantially more to Venus. This is further confirmed by the dollar-weighted average OEV bid as a share of collateral seized: 3.71% for RedStone versus 2.32% for Chainlink.
| Metric | RedStone | Chainlink |
|---|---|---|
| Recapture efficiency | 78.36% | 50.7% |
| Dollar-weighted OEV/collateral seized ratio | 3.71% | 2.32% |
On the liquidations each provider won, RedStone returned roughly 1.5x more value to Venus per dollar of available bonus. Both metrics point in the same direction. To put this in concrete terms, assume Venus generates $10M in total OEV over the next five years, a conservative figure given current growth. Applying the recapture efficiency observed during the trial:
- RedStone returns roughly $7.8M to the Venus treasury
- Chainlink returns roughly $5.1M
Unlike single-window coverage statistics, it does not depend on which specific events fell inside a 90-day sample. It reflects the fundamental economics of the system on every liquidation it processes.
Metric 2: OEV Coverage by Count
Coverage measures the share of eligible liquidation opportunities that were actually captured via OEV. Attribution is based on which vToken price change triggered each liquidation.
Note: the figures below exclude the THE market manipulation incident of March 15, 2026. Explained further below.
RedStone covered 76.9% of eligible events versus Chainlink’s 40.5%.
The formula
Coverage by count = Captured Liquidations / (Captured Liquidations + Missed Liquidations)
Note: The metric excludes liquidations where total collateral seized was below $5, filtering out dust events that would otherwise inflate count-based figures.
Why Count-based Metrics: The Structural Sensitivity Of Dollar-weighted Metrics.
The argument for prioritizing dollar-weighted OEV performance is reasonable: liquidation value concentrates in a small number of days per year, and a system that fails on those days loses most of its value regardless of how it performs the rest of the time. We agree with this framing in principle, but it cuts both ways, and the trial data shows exactly how.
The chart below shows missed liquidations above $500 by count, broken out by date and cause token, for both providers.
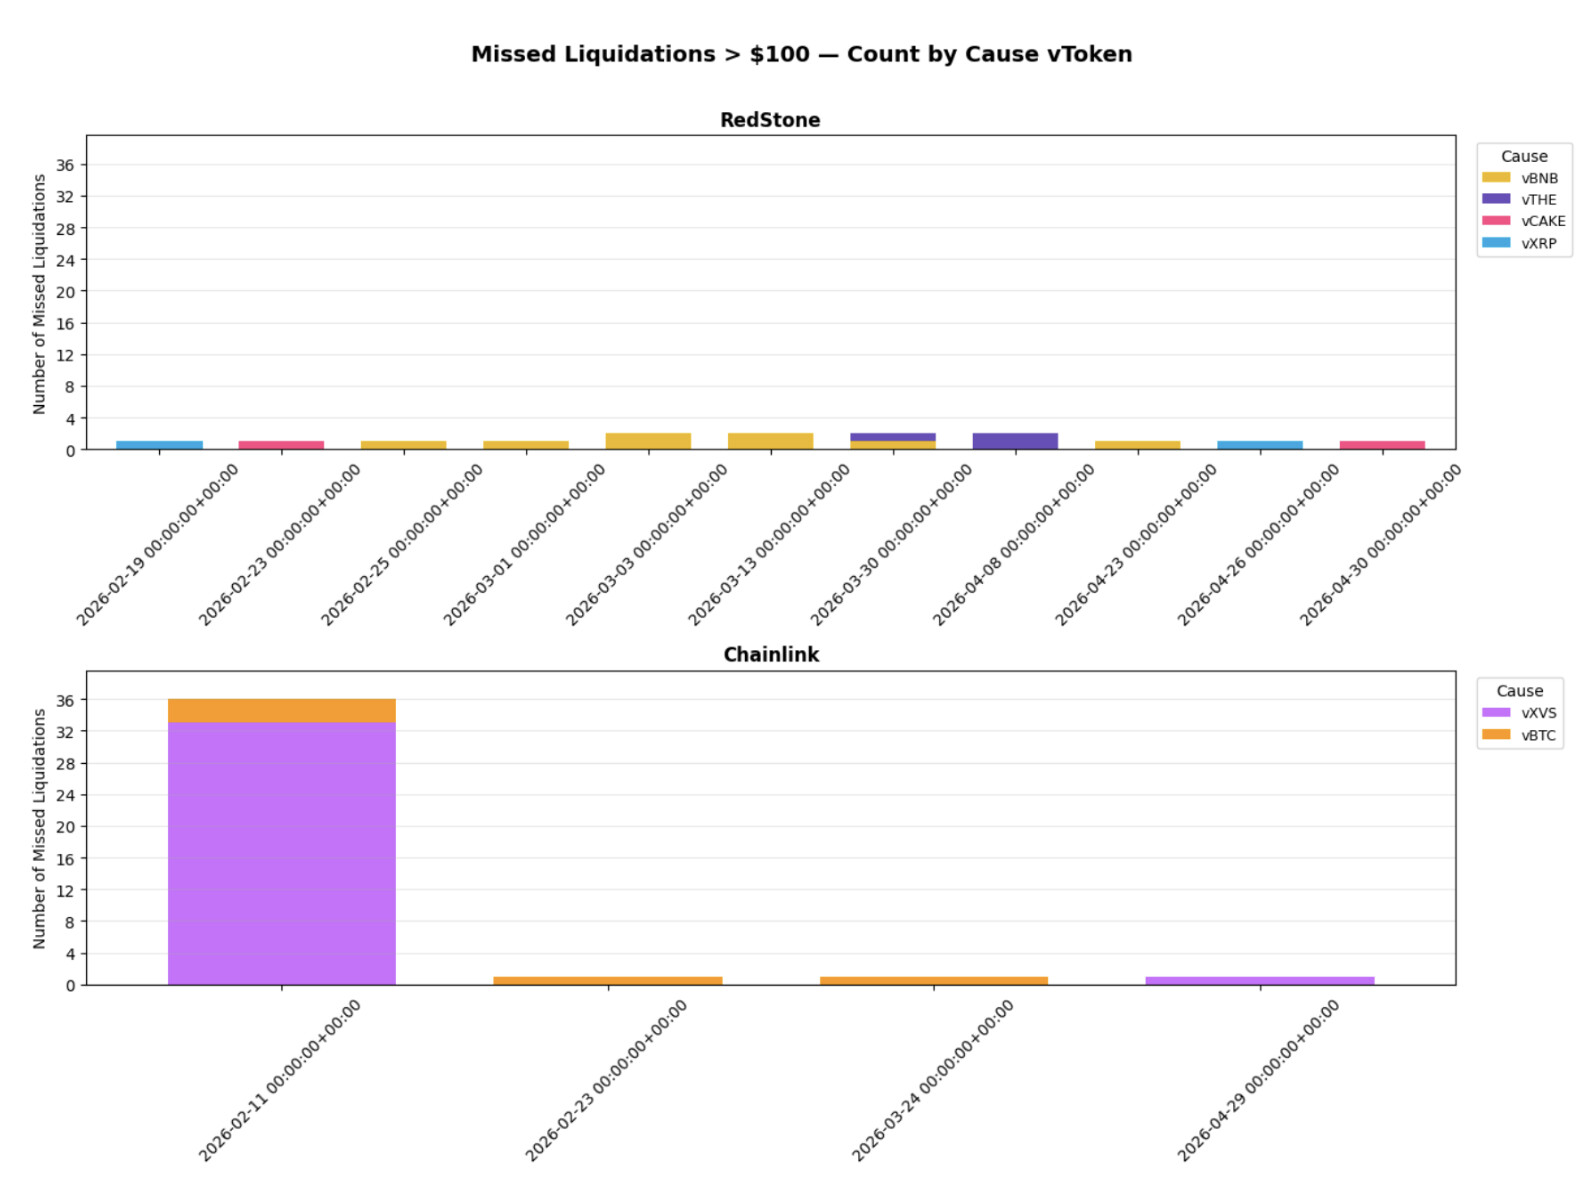
Chainlink missed roughly 36 liquidations on a single day in February, primarily vXVS and vBTC. These were not trivial events. Over 30 missed opportunities above $500 on one day is a real operational signal. Those positions happened to be individually sized in a way that did not show up heavily in dollar-weighted statistics. That is the definition of a metric that is sensitive to which events fell within a given window, not a validation of consistent performance.
RedStone’s misses are spread across multiple dates and tokens, with low counts per event. Two of our misses happened to involve large positions. These occurred early in the evaluation period during initial system calibration, and a fix was deployed the following day. No similar event occurred in the months that followed.
The broader point: dollar-weighted coverage over 90 days rewards providers whose misses happened to coincide with smaller positions during that specific window. It is not a stable signal over short periods with fat-tailed value distributions.
Count-based coverage treats each eligible opportunity equally. It answers a cleaner question: how reliably does the system respond across the full distribution of events?
RedStone responded to 76.9% of eligible events by count, compared to Chainlink’s 40.5% over the full evaluation period.
THE Manipulation On March 15
The March 15 incident was a premeditated, nine-month-planned exploit, not a routine market event. The attacker accumulated a dominant position in THE, seeded non-standard pools immediately before the attack, and withdrew right after, creating skewed market conditions that were exploited during the liquidation flow.
We recommend excluding this event from coverage statistics, as we have done throughout this analysis. As a cross-check: Chainlink’s solution captured zero of its 116 eligible liquidations with THE as one side of the pair on that day, representing approximately $224,756 in missed collateral. These were spillover liquidations from the same manipulation event, and Chainlink captured none of them under the same market conditions. Had the asset configuration been flipped and THE been a Chainlink OEV token, the capture picture on that day would almost certainly have looked the same. March 15 was exceptional for all external solvers equally.
Solver Participation In Atom Auctions
Atom OEV ran as a closed pilot during the trial period. Following our transition away from Fastlane after its acquisition by Chainlink, the auction system was rebuilt from scratch using RedStone’s own proprietary infrastructure. The solver set was intentionally restricted while that system was validated in production. Two weeks ago, we opened Atom to external participants, and the first external solvers are already being onboarded. If you are interested in integrating, documentation is available here, and we encourage the community to reach out.
Summary
Across the metrics that reflect consistent operational reliability over a long time, the data favors RedStone. It is true that Atom experienced initial hiccups during the trial, which were quickly resolved. Looking past the ramp-up, the system is 50% more efficient on value recaptured per dollar of opportunity and roughly 90% more sensitive on the count of liquidations captured. Both numbers point to a more scalable system as Venus grows in TVL and the onchain activity intensifies.
That said, three months is not a sufficient window to make a structural decision about infrastructure this critical:
- The Thena manipulation distorted the trial. The March 15 exploit was a premeditated attack on Venus’s liquidity routing, structured to make external solver competition impossible in real time. It also fell asymmetrically on the provider securing the THE feed.
- Asset assignment skews the comparison. OEV opportunity is not evenly distributed across assets. Some vTokens generate substantially more recapturable value than others, and liquidity depth varies significantly between the underlyings. A large notional liquidation on a thinly traded asset is structurally harder to capture than an equivalent position on a deep market. Part of the measured gap reflects the assets each provider was assigned and the liquidity conditions behind them, not the systems being compared.
- Liquidation value clusters around stress events that occur every few months. Two or three days a year typically account for the majority of annual OEV. A robust evaluation needs at least two or three such events. The current window includes only one.
- Both providers missed opportunities, and both shipped fixes. Extending the trial lets the DAO observe how each system responds to the lessons of the first window before committing to a single provider for a long period.
Recommendation
Extend the dual-vendor configuration for an additional six months under two modifications agreed by the Venus core team and both providers:
- Rotate asset coverage, so each provider secures a comparable distribution of high-OEV and low-OEV assets across the next window.
- Publish a shared methodology for recapture efficiency, count-based coverage, and uptime, so results are comparable rather than provider-defined.
This extended period will properly verify the initial numbers under fairer, more representative conditions. Two independent OEV providers are themselves a form of decentralization at the liquidation layer, maintaining competitive pressure on both sides and giving Venus an operational fallback if either system degrades. Beyond the immediate trial, RedStone’s expanding OEV infrastructure, including RedStone Settle for RWA liquidation, positions Venus to capture OEV in the fastest-growing DeFi category ($30B+ market cap, 200% YoY growth) as the protocol expands into tokenized real-world assets.
RedStone is committed to the highest standards of security and performance on Venus, and we look forward to continuing to build on this foundation with the community.