Summary
September was a calm month across Venus markets. Liquidations declined 99% in value month over month, while collateral assets appreciated across the board.
Looking forward, BTC-collateralized positions are Venus users’ main risk sensitivity. A 30% drop in BTC alone would put $88M of collateral at risk, against $51M if all volatile assets fell together.
Through September, protocol supply reached $1.72B while debt declined 7.2% to $406M. On the growth front, Venus added Centrifuge’s tokenized Treasuries and CLOs to the USDT Liquidity Hub and queued an opt-in ETH E-mode group to facilitate the leverage looping trade.
1. Market Context & BNB Price
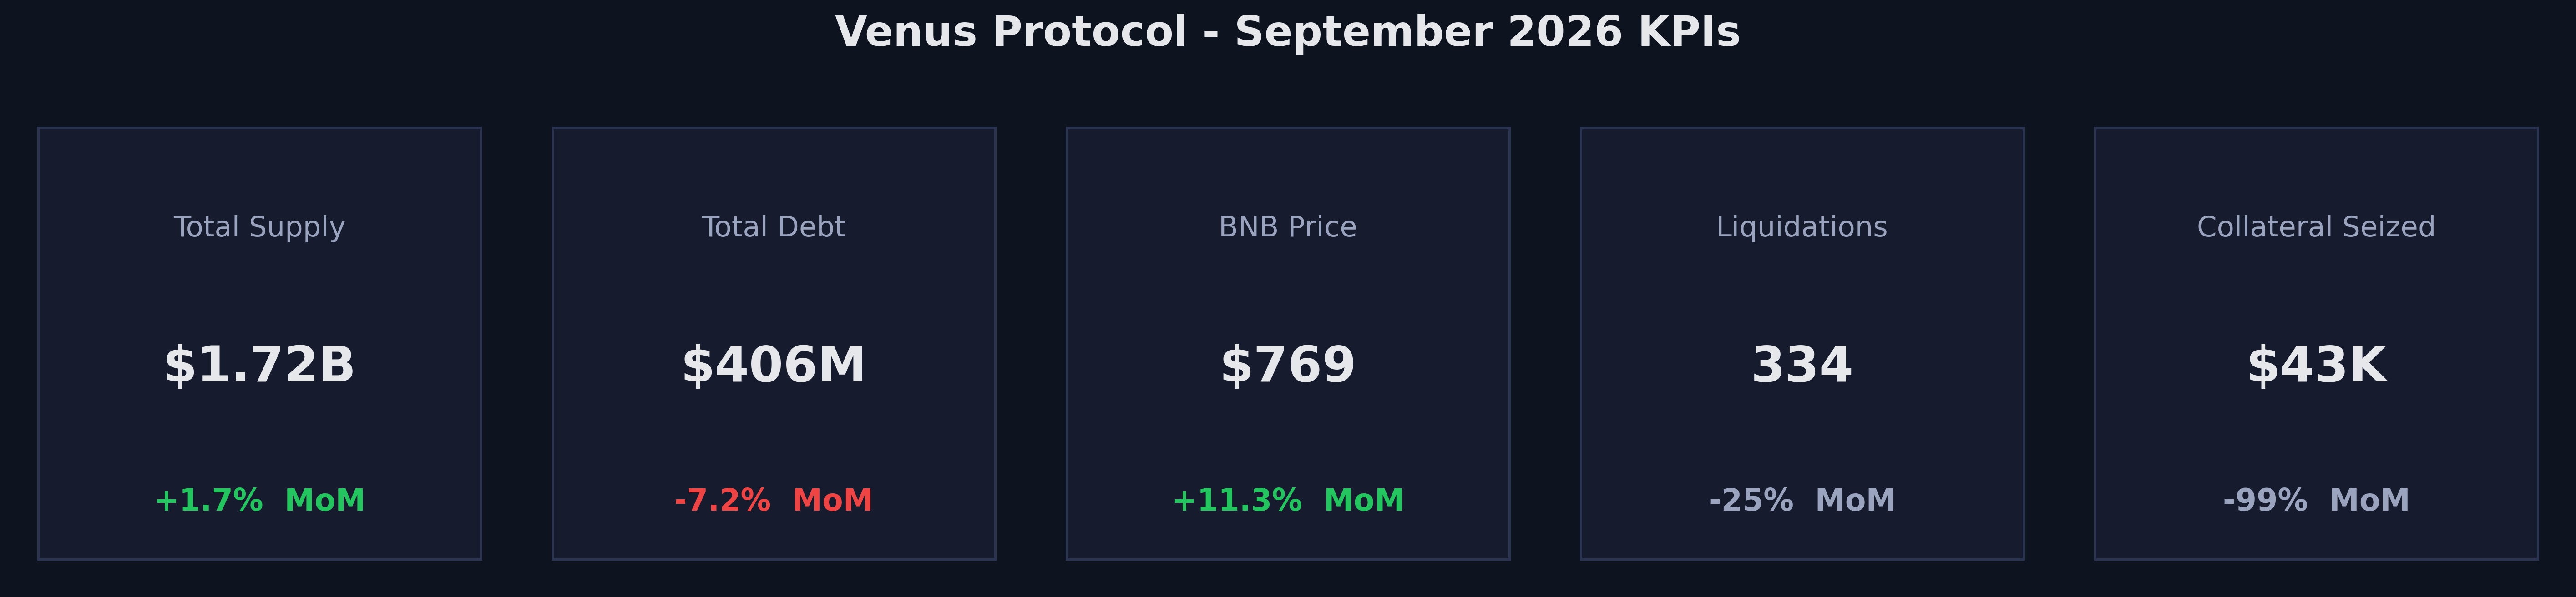
KPI Summary
- Total Supply: $1.72B (+1.7% MoM)
- Total Debt: $406M (-7.2% MoM)
- BNB Price: $769 (+11.3% MoM)
- Liquidations: 334 events (-25% MoM)
- Collateral Seized: $42.8K (-99% MoM)
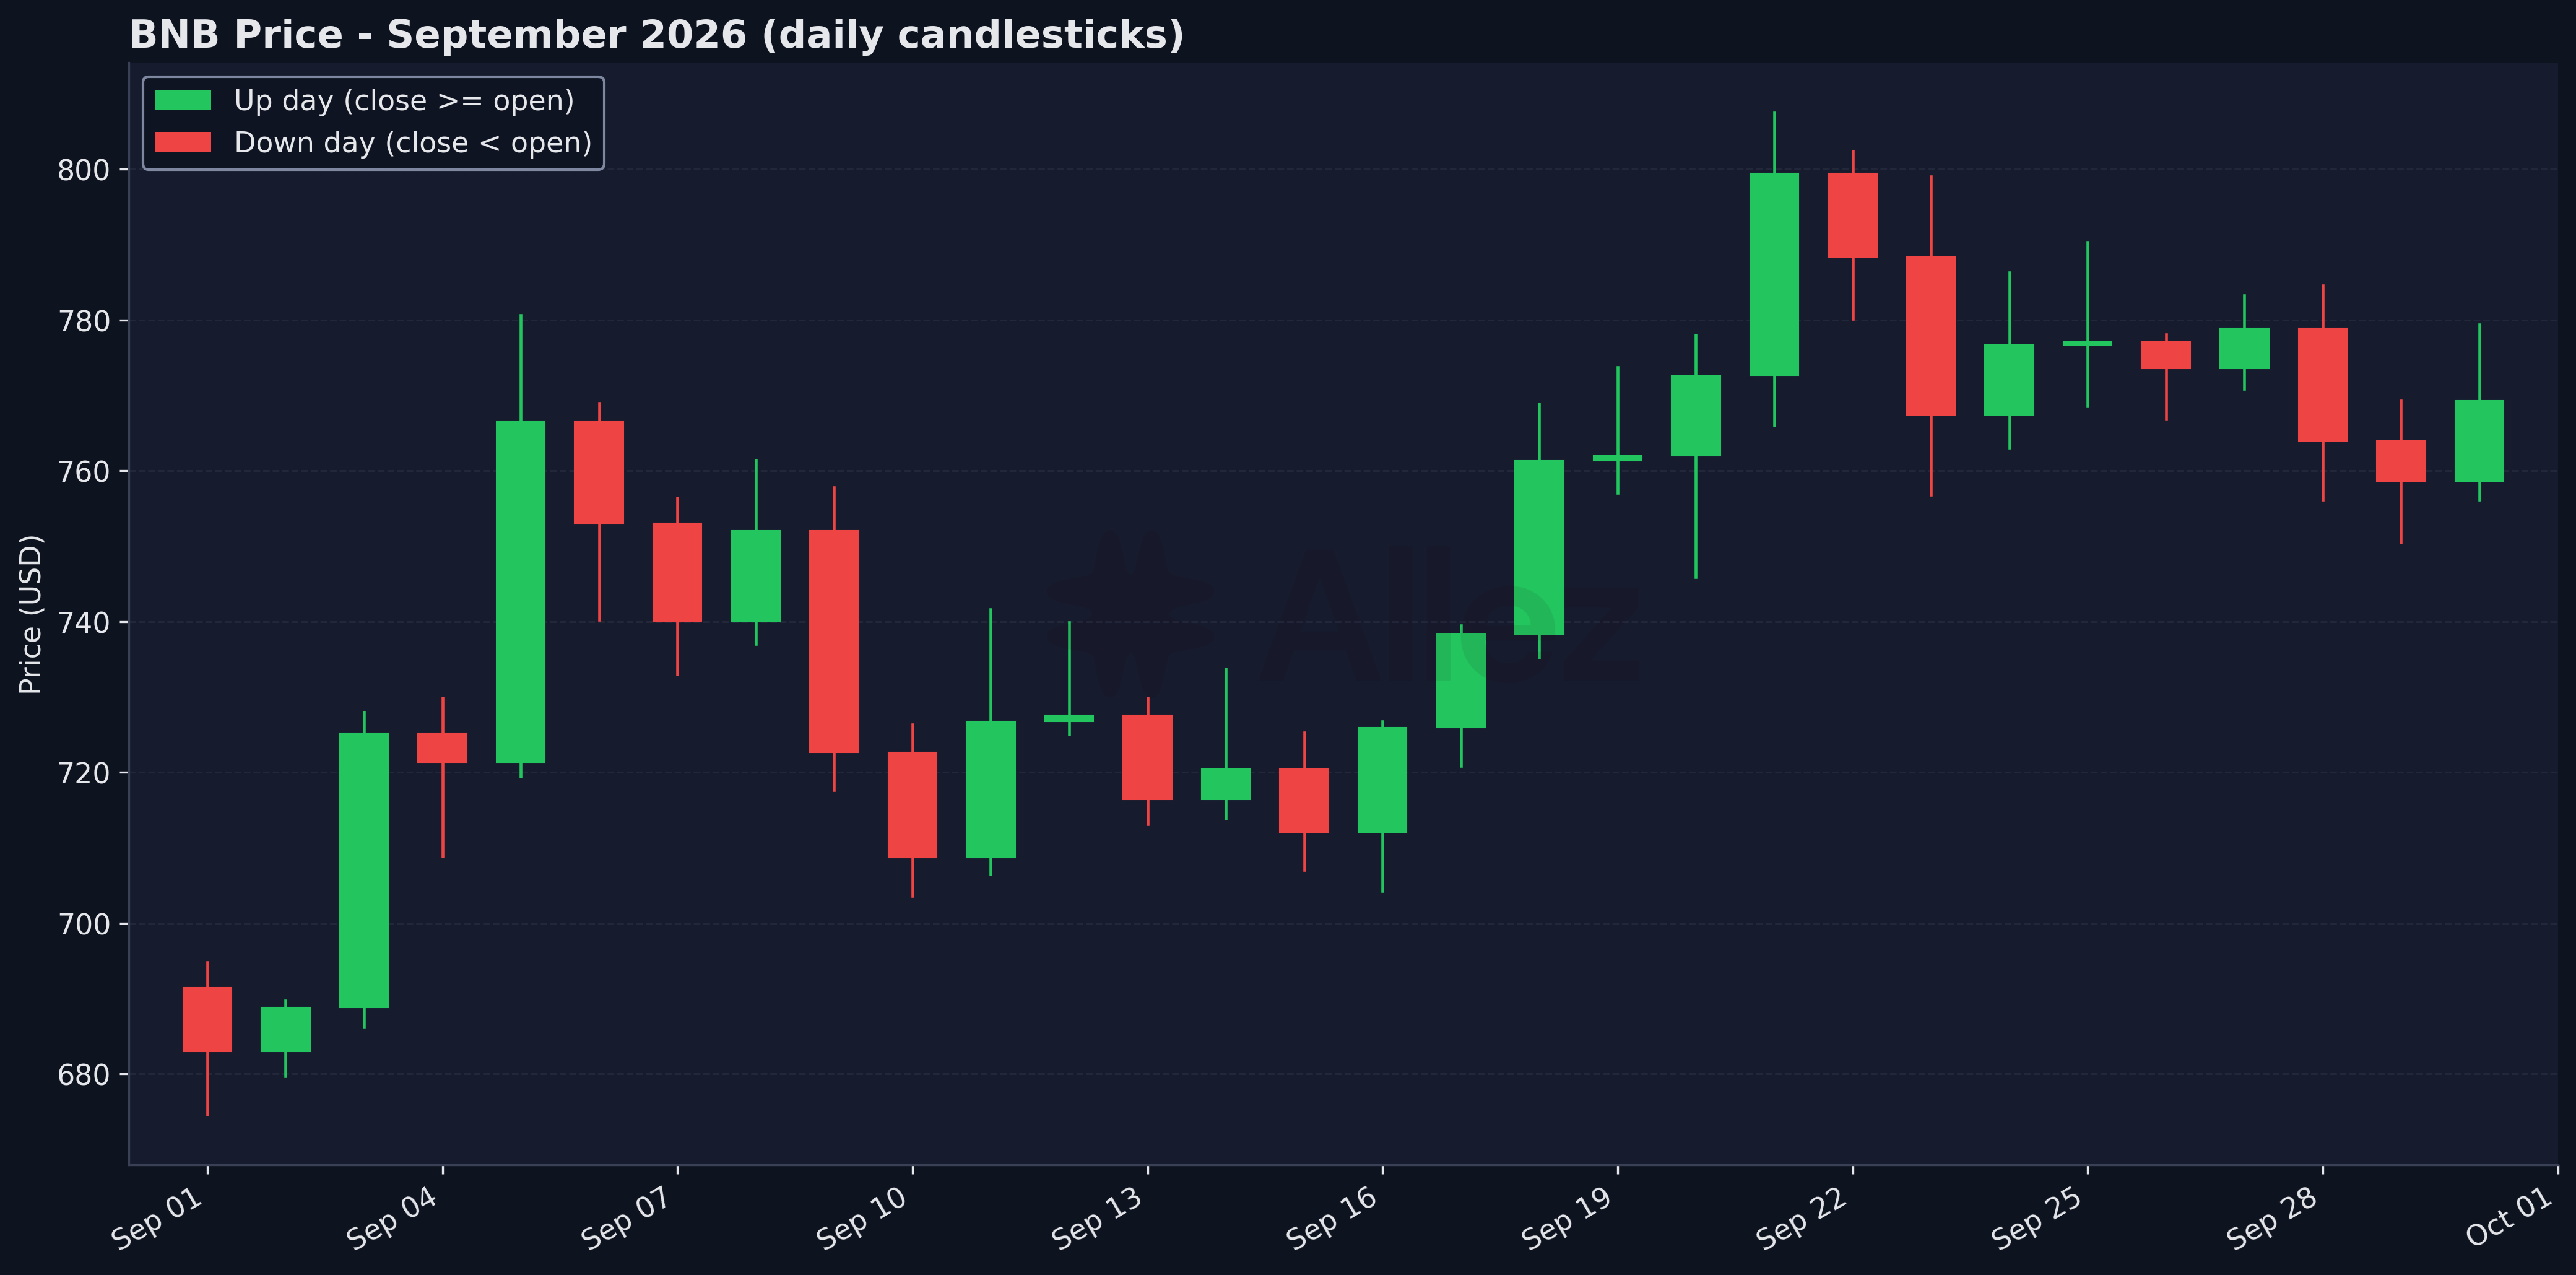
BNB Price - September 2026
BNB opened September at $691, set its low of $675 on September 1, peaked at $807 on September 21 and closed at $769 (+11.3%). BTC and ETH rose 6.5% and 8.8% respectively.
Venus Ecosystem Updates:
- VIP-663 (executed September 28). TRX and lisUSD moved to the next stage of deprecation, following the August DeviationSentinel reviews.
- VIP-662 (executed September 21). Atlas moved from fallback to pivot oracle on 13 Core Pool markets and became VAI’s only price source. VAI Vault rewards stopped as the first step of winding VAI down.
- VIP-661 (executed September 21). The USDT Liquidity Hub added two Centrifuge funds, JTRSY (US Treasuries) and JAAA (AAA-rated CLOs).
- ETH E-Mode proposal (VIP-664, queued). Proposal to add an ETH E-mode to support higher-leverage ETH LST looping.
- bStock borrow incentives (September 23 to October 14). Merkl rewards on USDT and U borrowed against bStock collateral.
- Other. VIP-660 allocated $80K of September Prime rewards (September 6); Venus joined the BNB Chain bug bounty, up to $100K per critical finding (September 9); and the 1M USDT Fixed-Term Vault matured on September 30 with a 4.2% realized APR.
2. Supply & Market Overview
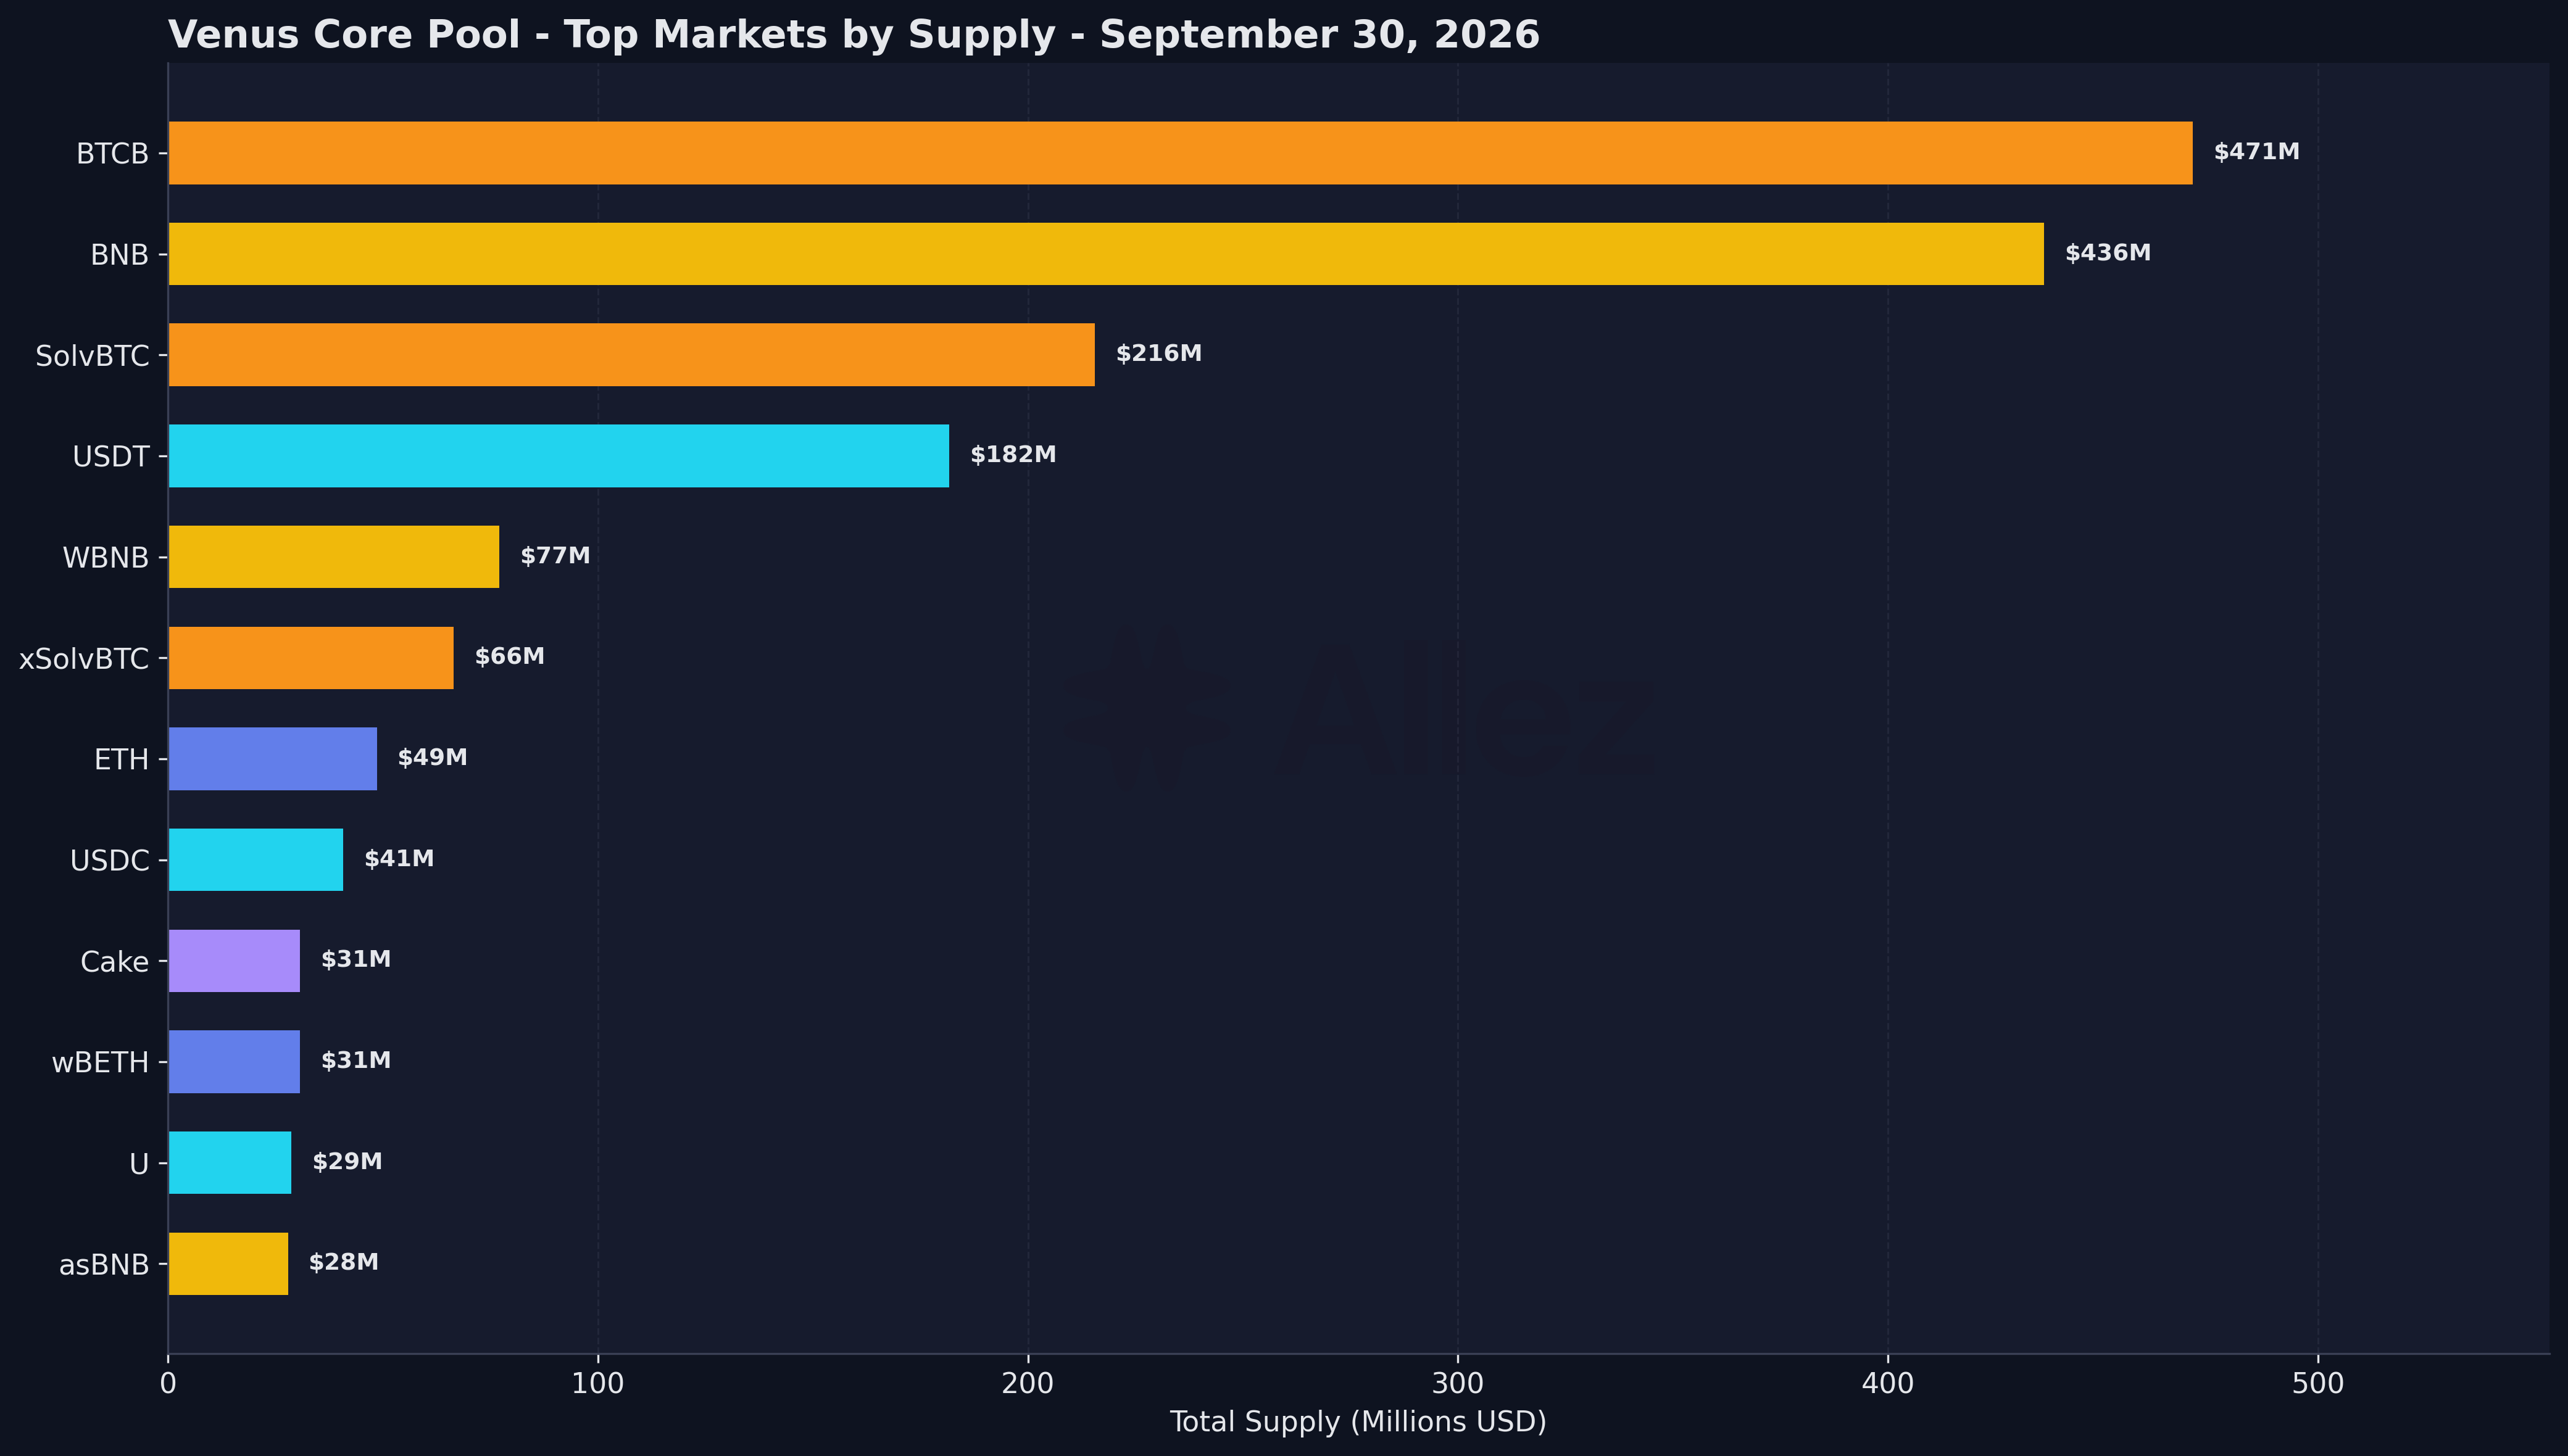
Supply by Market
Top markets by supply (September 30, 2026):
| Market | Supply | MoM | Token MoM | Debt | Utilization |
|---|---|---|---|---|---|
| BTCB | $470.9M | +2.0% | -4.2% | $113.7M | 24.1% |
| BNB | $436.3M | +10.3% | -0.9% | $55.8M | 12.8% |
| SolvBTC | $215.5M | +6.5% | 0.0% | $0.2M | 0.1% |
| USDT | $181.7M | -4.9% | -4.9% | $135.0M | 74.3% |
| WBNB | $77.0M | +3.8% | -6.8% | $8.1M | 10.5% |
| xSolvBTC | $66.5M | +6.4% | 0.0% | $0.0M | 0.0% |
| ETH | $48.6M | +3.2% | -5.1% | $34.6M | 71.2% |
| USDC | $40.7M | -17.6% | -17.6% | $31.2M | 76.7% |
| Cake | $30.7M | +27.3% | -9.0% | $0.2M | 0.8% |
| wBETH | $30.7M | +18.8% | +9.0% | $0.7M | 2.4% |
Total supply rose 1.7% to $1.72B: price gains added $136M and net withdrawals, valued at month-end prices, were $107M. More than half of the withdrawals came from one market, asBNB ($58.5M). SolvBTC and xSolvBTC balances held steady, and wBETH (+9.0% of tokens, $2.5M) and U (+7.2%, $1.9M) drew new deposits.
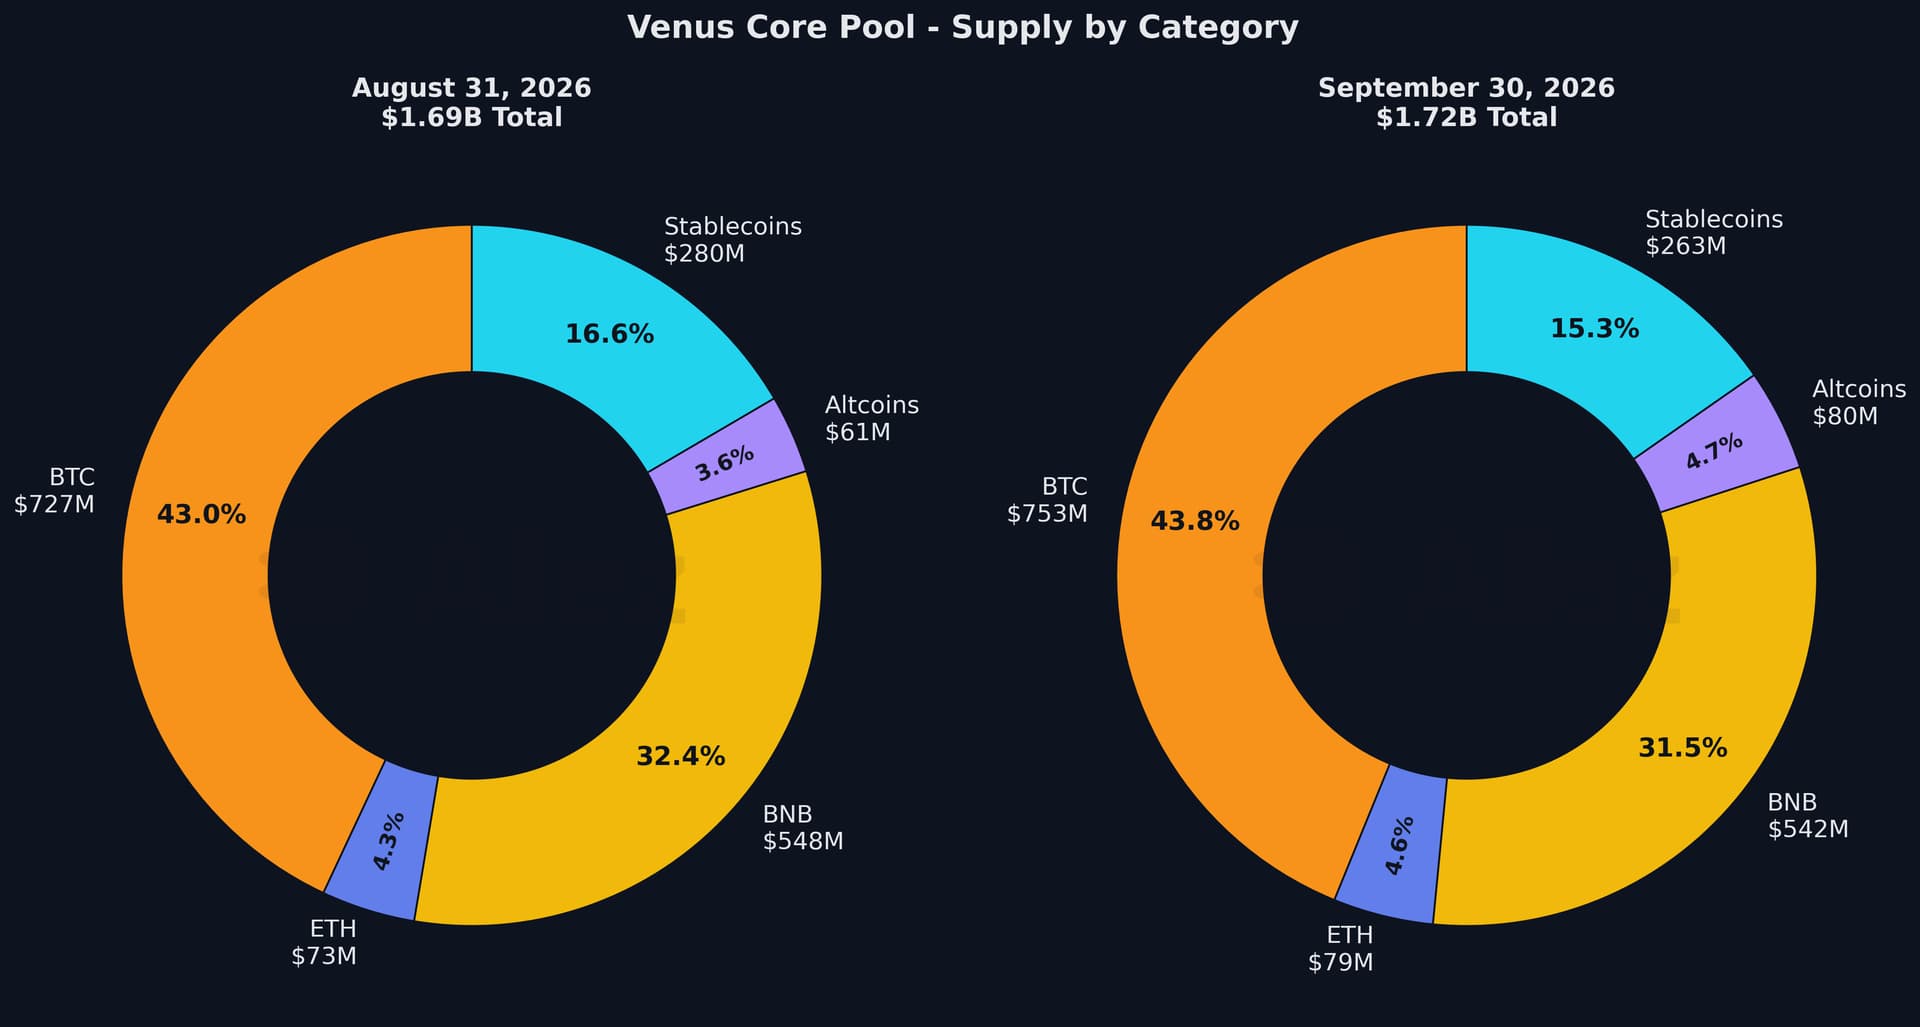
Category composition (September 30, 2026):
| Category | Supply | Share | MoM | Debt |
|---|---|---|---|---|
| BTC | $752.9M | 43.8% | +3.6% | $113.8M |
| BNB | $541.9M | 31.5% | -1.1% | $63.9M |
| Stablecoins | $263.0M | 15.3% | -6.0% | $190.6M |
| ETH | $79.5M | 4.6% | +8.8% | $35.4M |
| Altcoins (incl. $0.7M RWA) | $80.4M | 4.7% | +31.6% | $2.3M |
BNB’s share fell 0.9pp despite the rally because of the asBNB withdrawal. Cake, the largest altcoin market, added 27.3% in value while its token balance fell 9.0%.
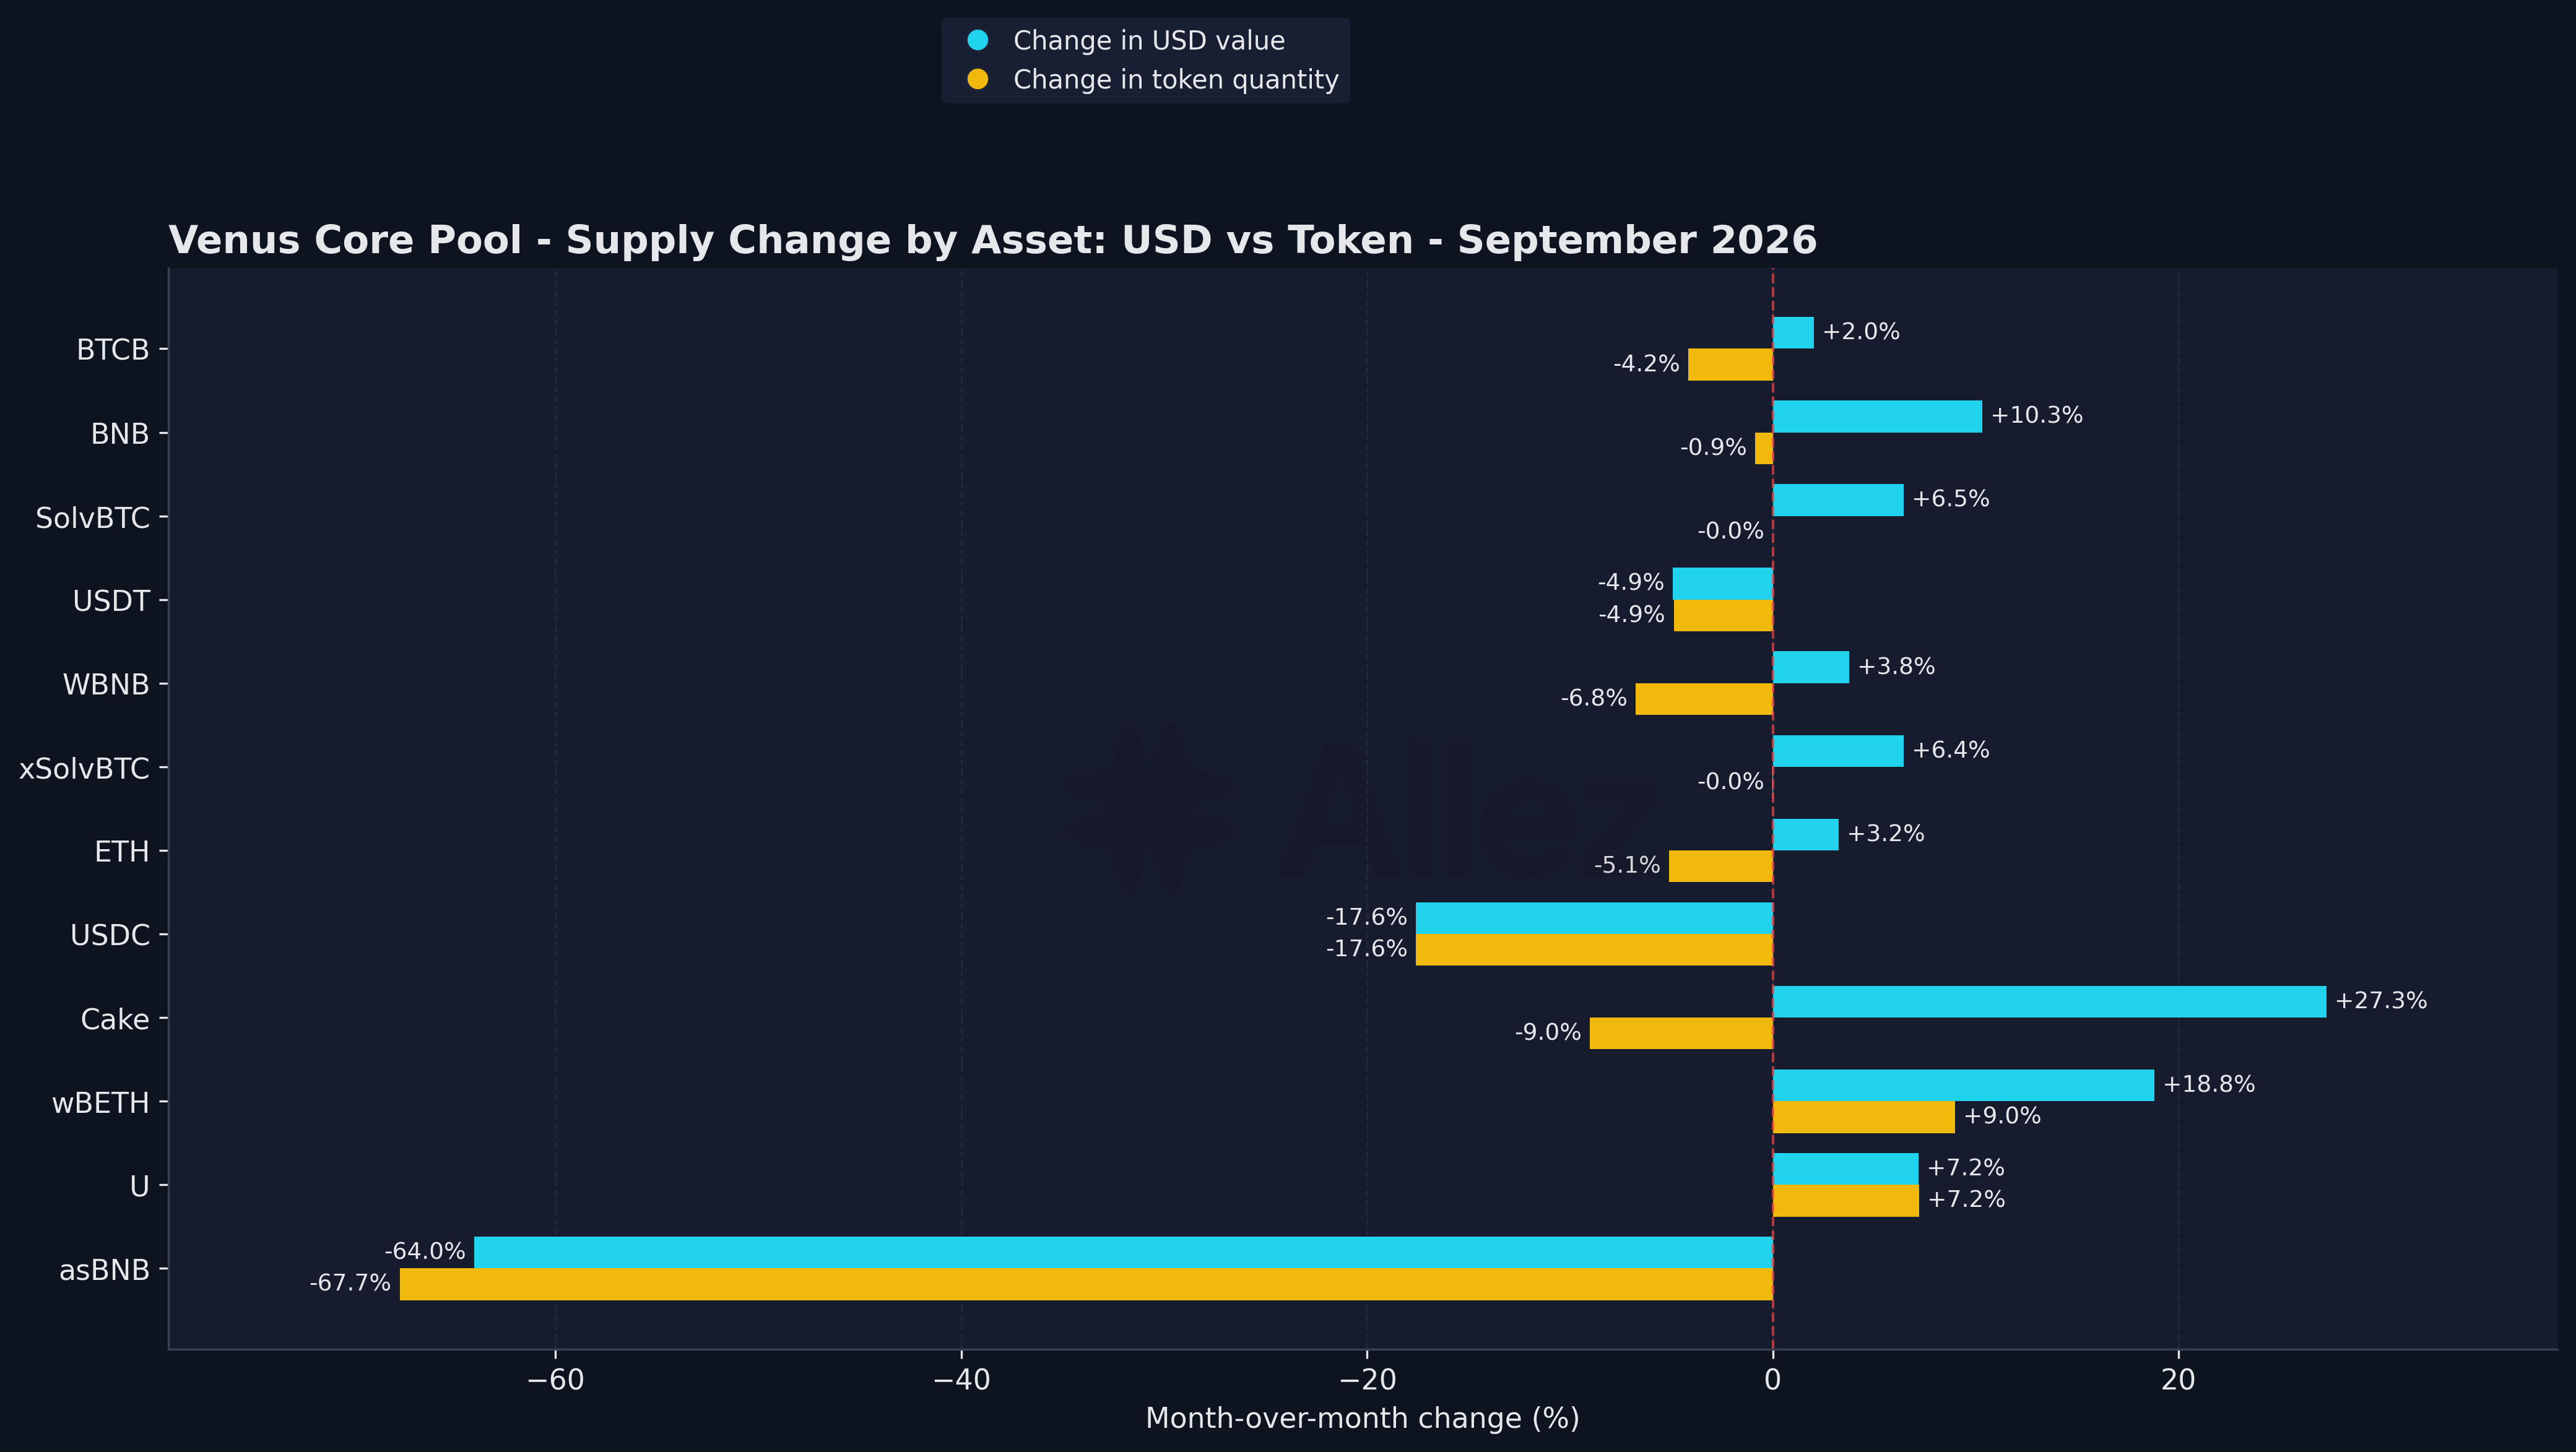
Supply Change by Asset
BNB debt fell from $115.6M to $55.8M, with two accounts making up $55.9M of the reduction (Section 3). ETH debt nearly doubled, $17.8M to $34.6M, most of it borrowed against BTCB (that pair rose from $2.0M to $17.4M across 353 accounts).
3. Risk & Liquidations
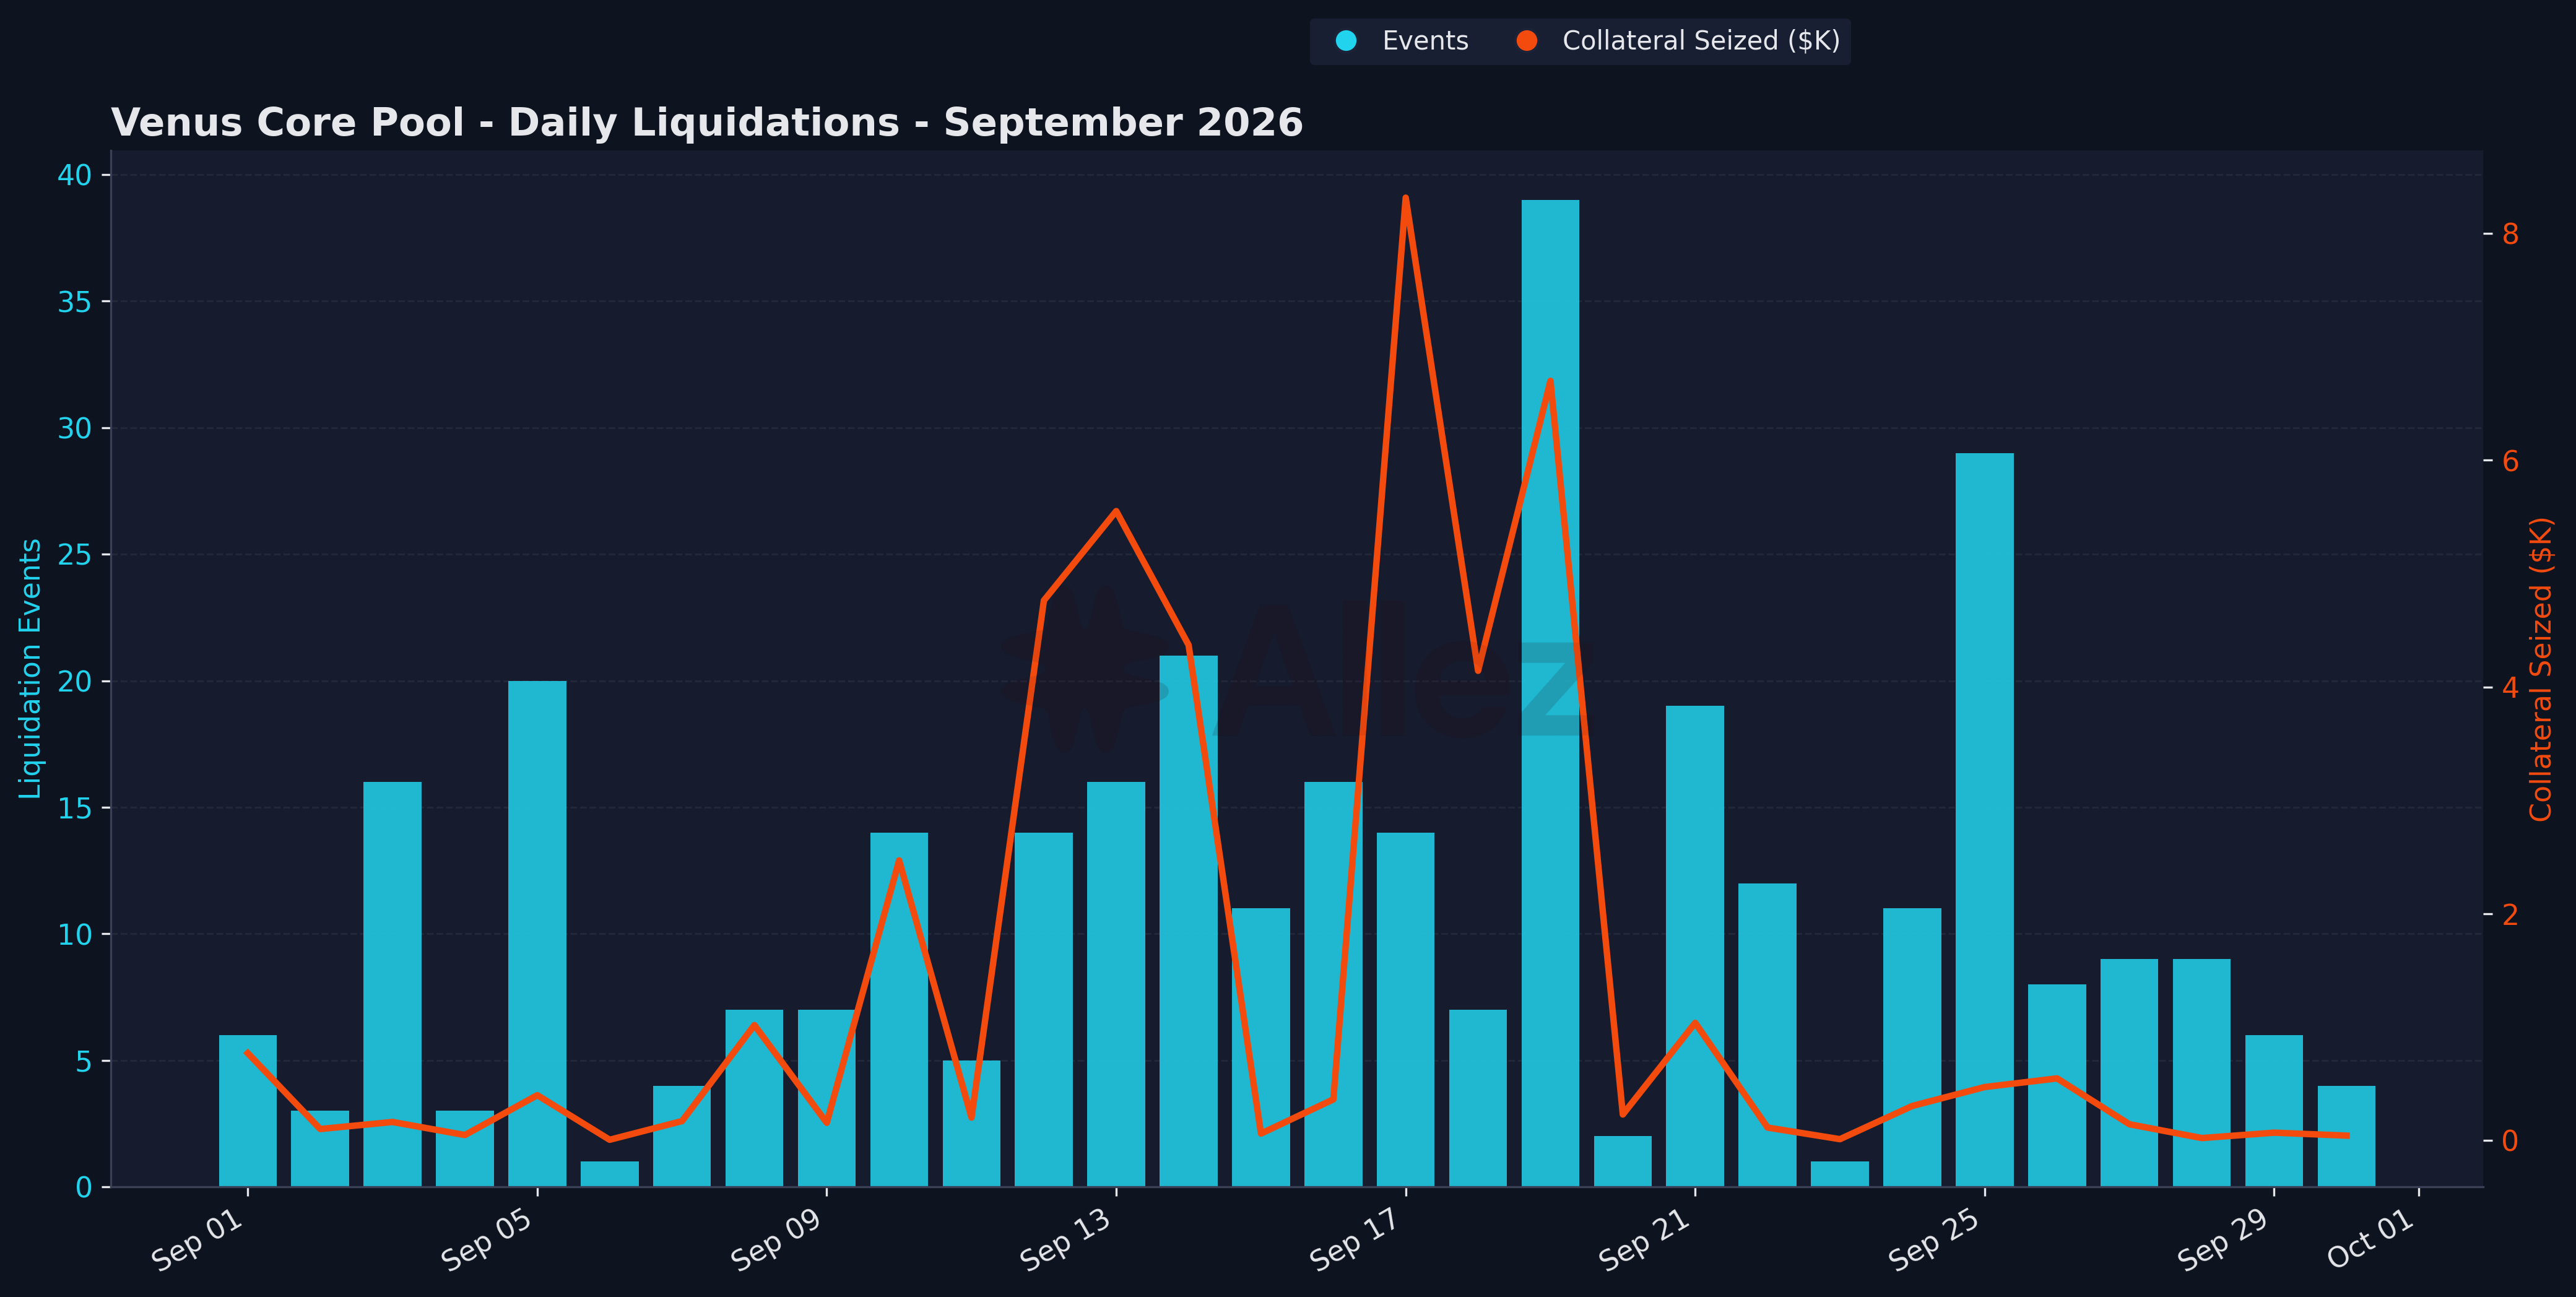
Daily Liquidations
Liquidation summary:
| Metric | September Total |
|---|---|
| Total events | 334 |
| Collateral seized | $42,761 |
| Debt repaid | $38,728 |
| Peak day (by value) | Sep 17 (14 events, $8,315) |
| Peak day (by count) | Sep 19 (39 events, $6,699) |
Liquidation activity was minimal across the month: 334 events seized $42.8K (August: 443 events, $3.12M).
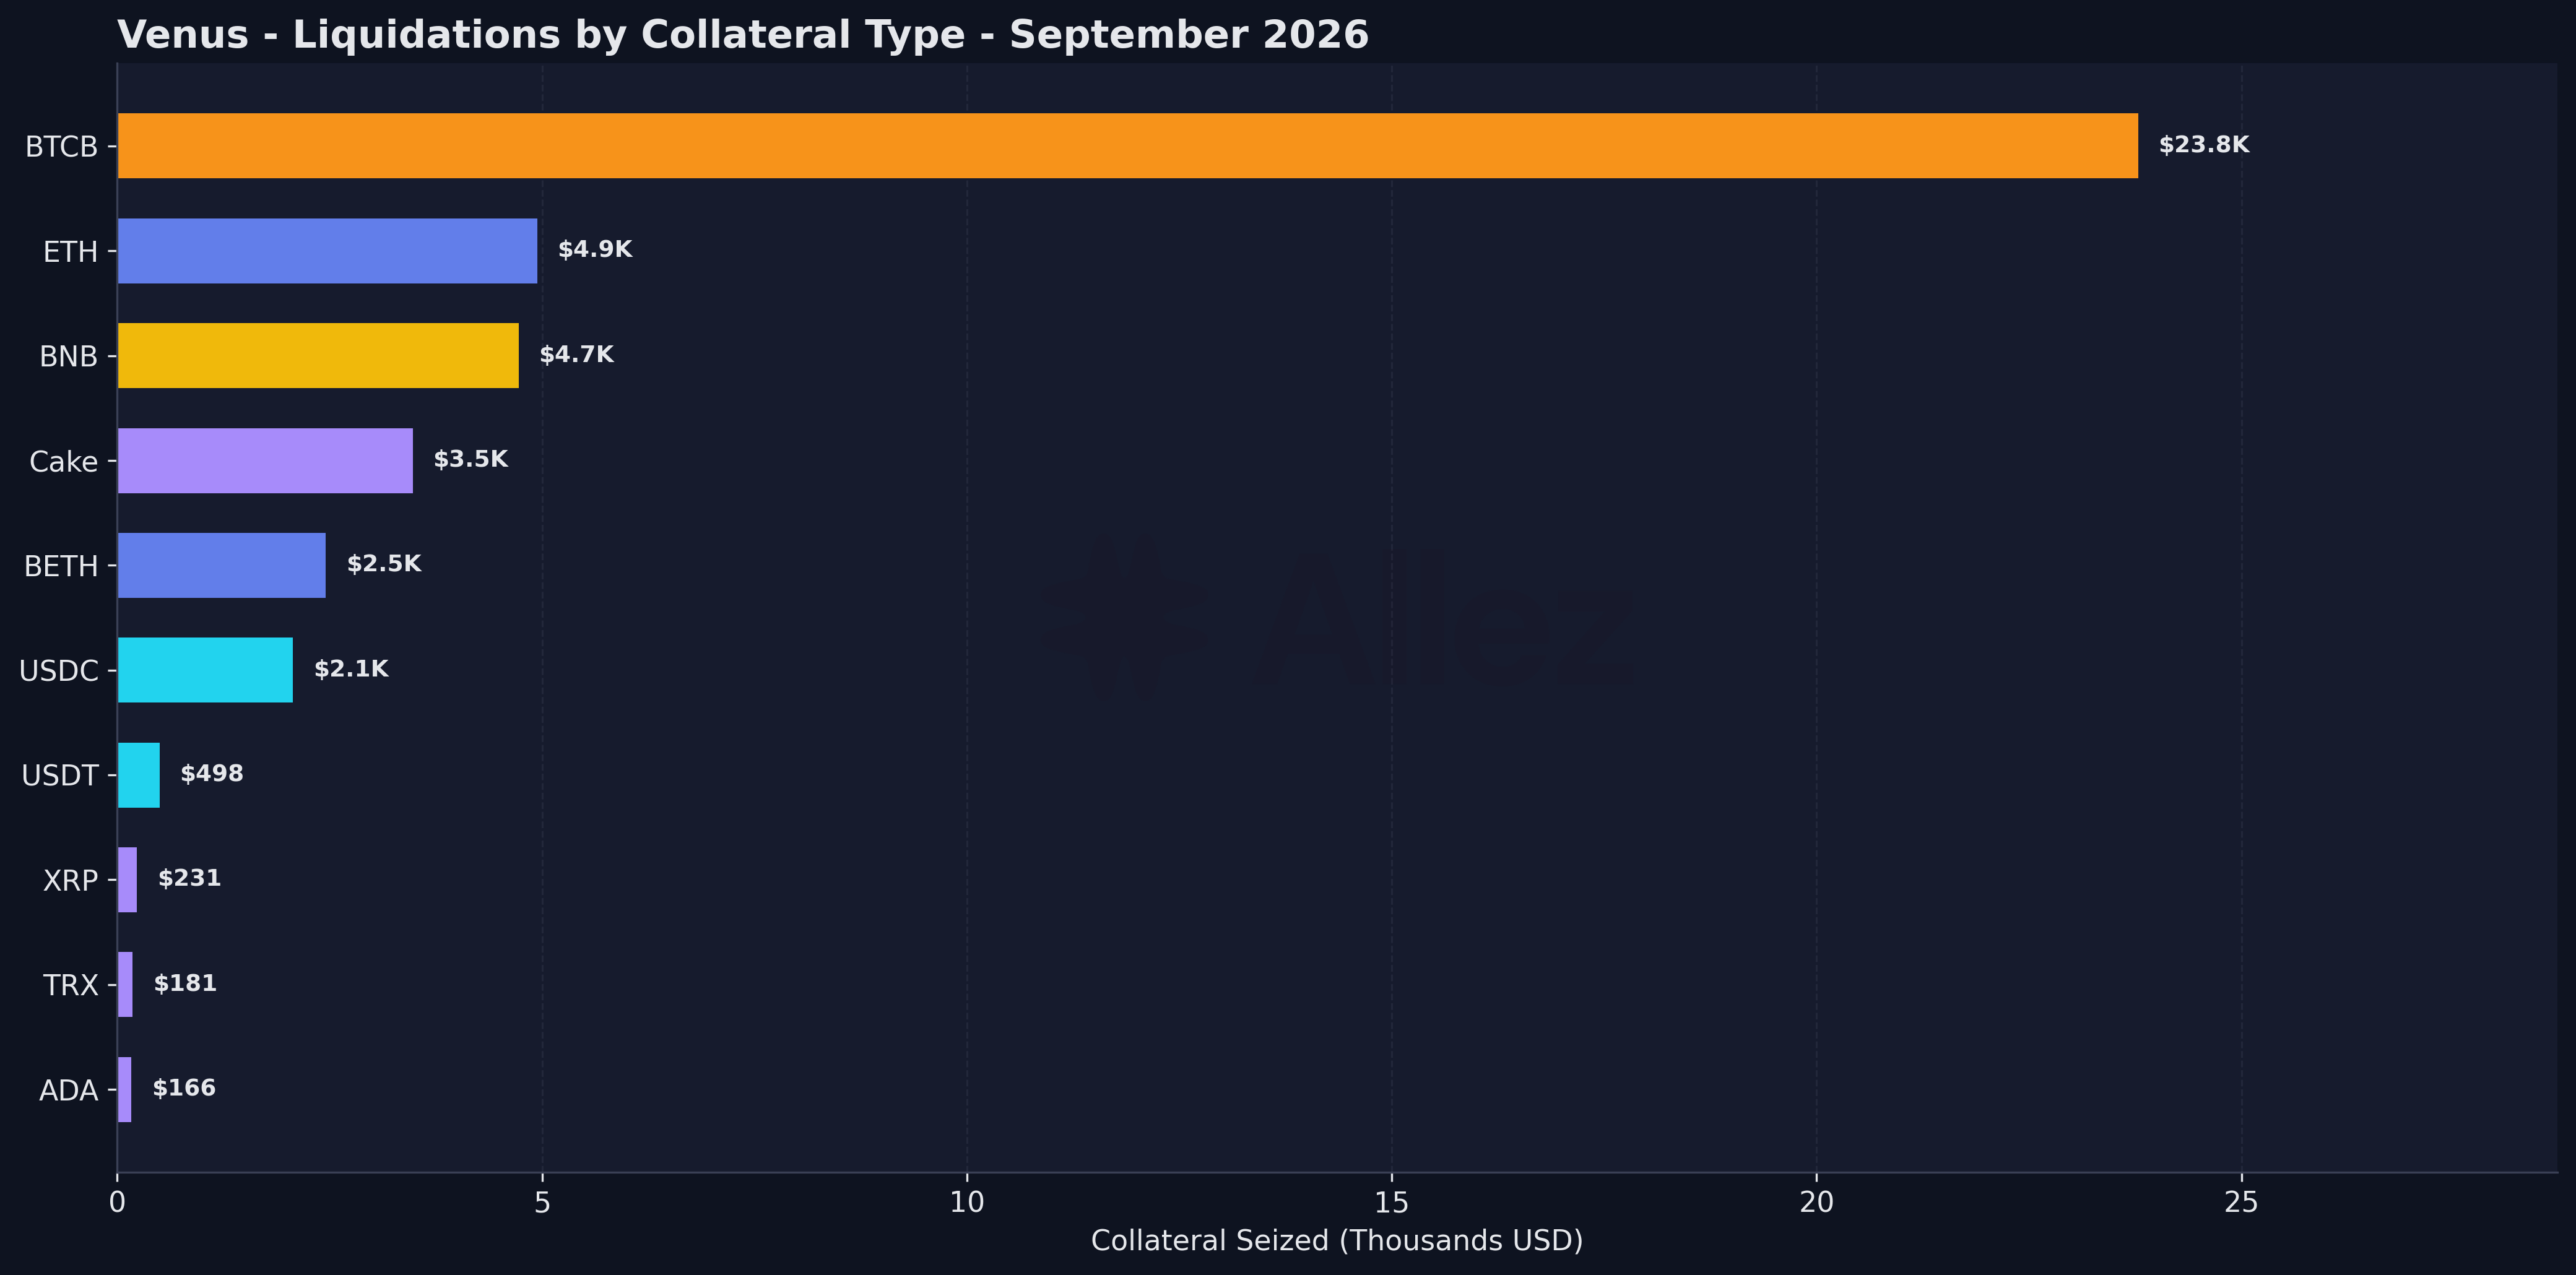
Liquidations by Collateral
Health factor distribution (September 30, 2026):
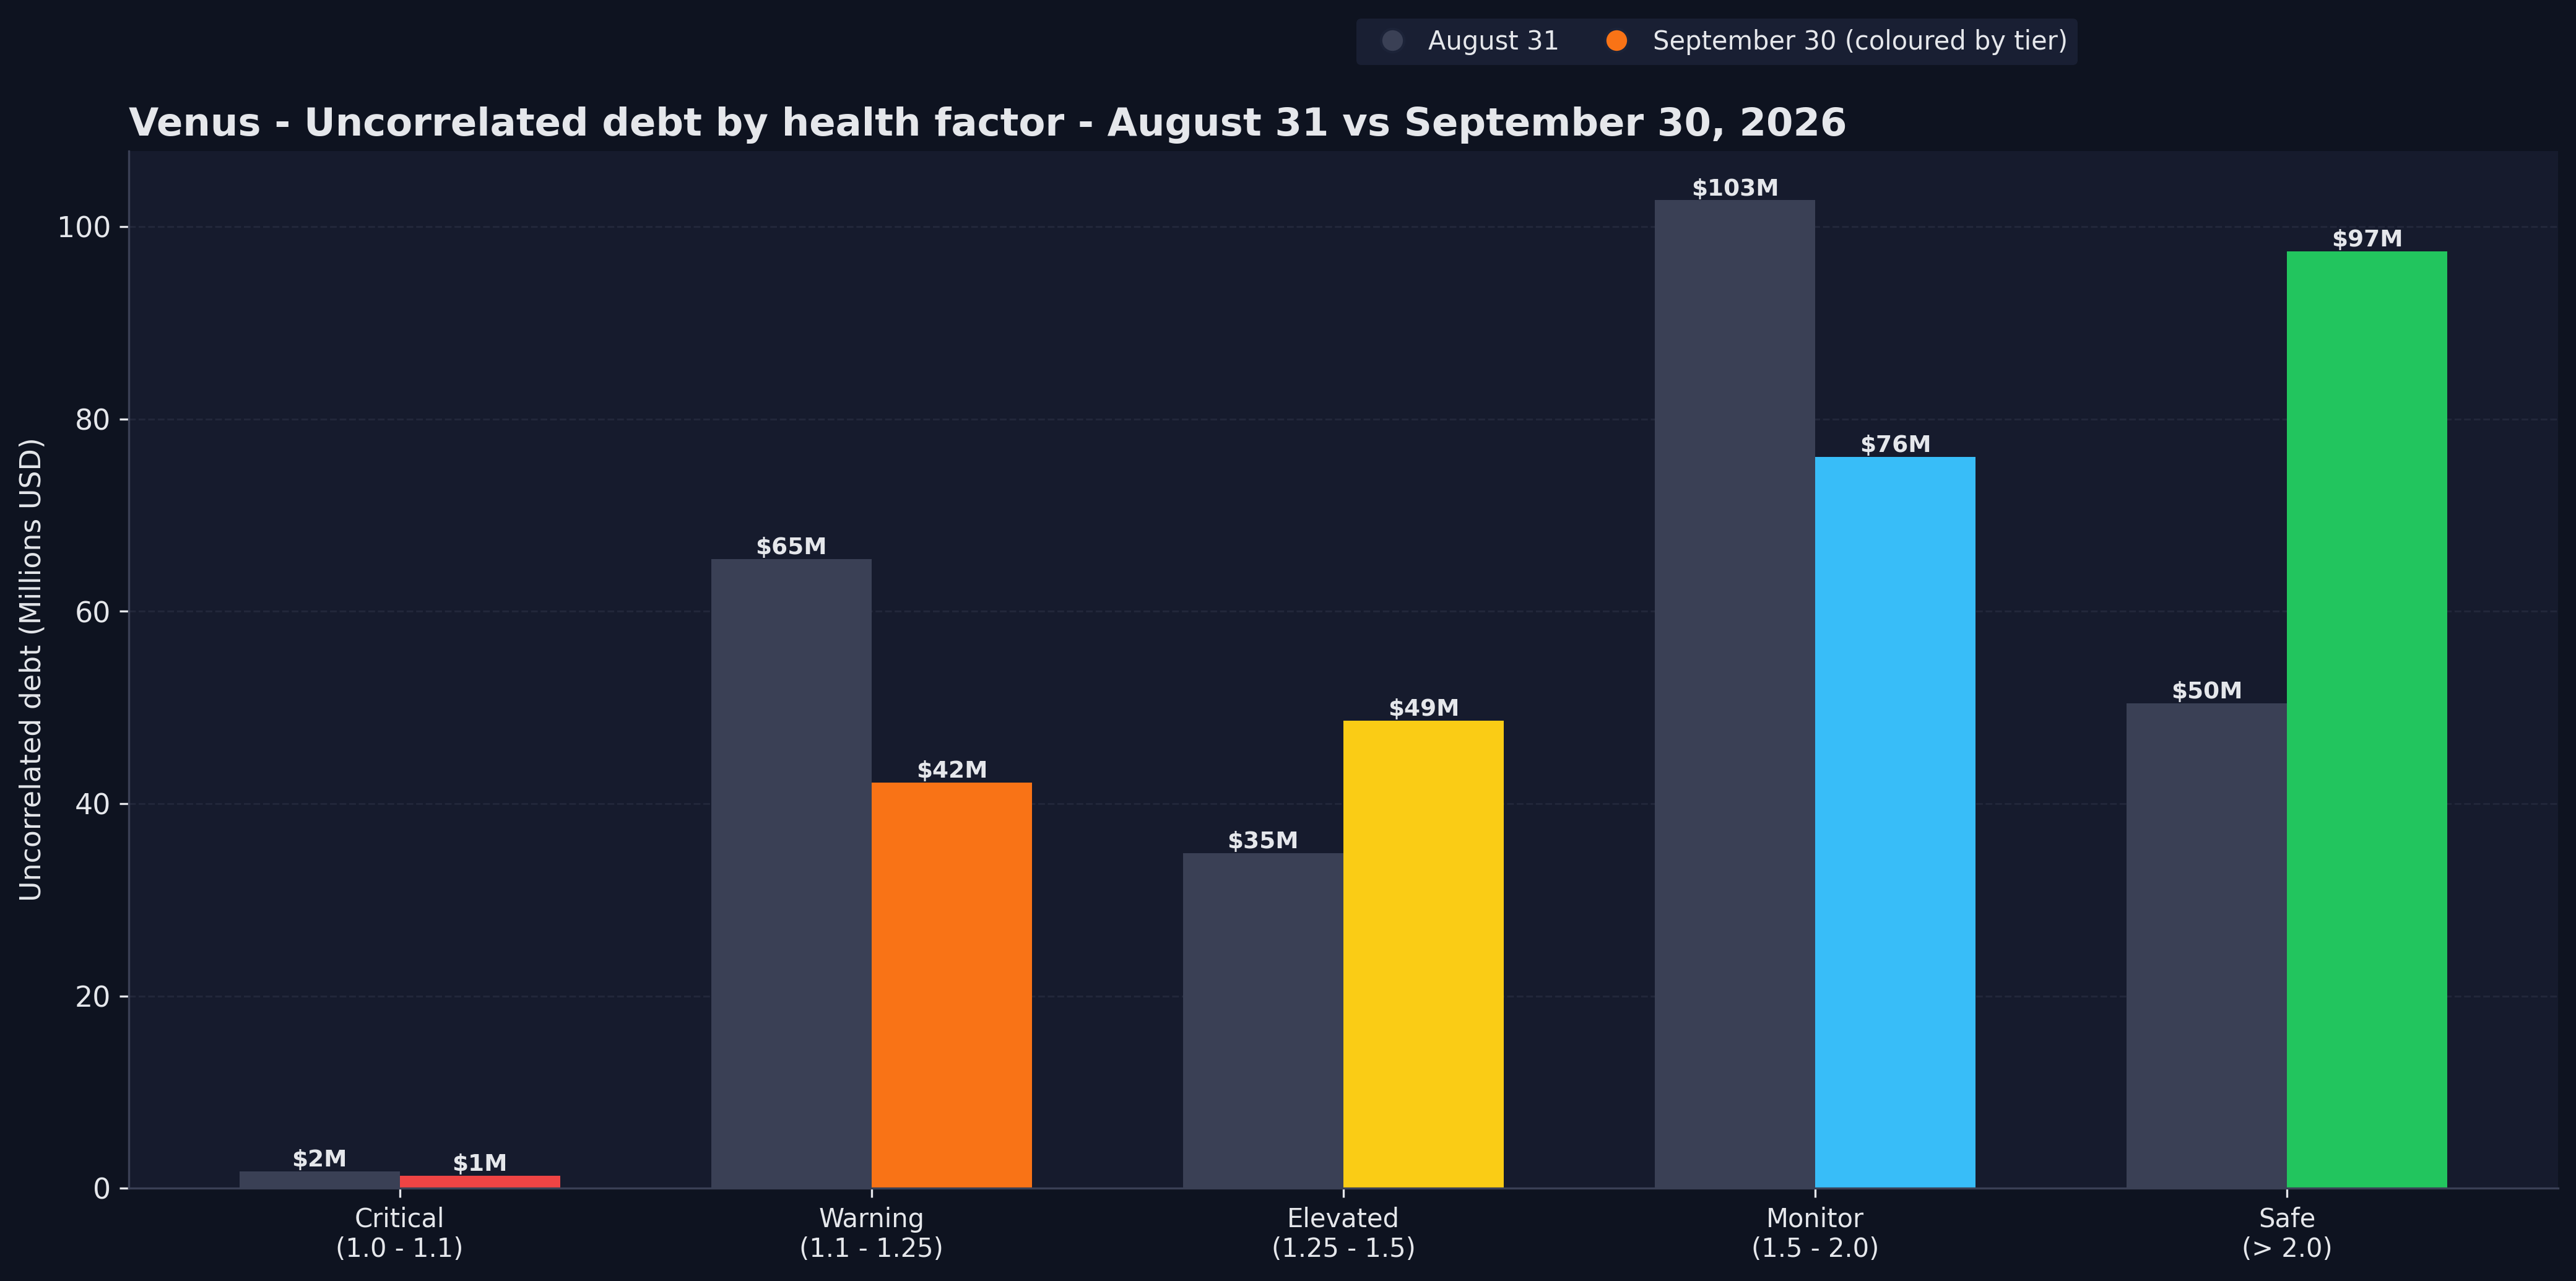
Health Distribution
| Tier | HF Range | Debt | Correlated | Uncorrelated | Uncorrelated MoM | Accounts |
|---|---|---|---|---|---|---|
| Critical | 1.0 - 1.1 | $39.9M | $38.6M | $1.3M | -27.0% | 929 |
| Warning | 1.1 - 1.25 | $88.3M | $46.1M | $42.2M | -35.5% | 1,392 |
| Elevated | 1.25 - 1.5 | $57.8M | $9.1M | $48.6M | +39.5% | 2,546 |
| Monitor | 1.5 - 2.0 | $119.7M | $43.6M | $76.1M | -26.0% | 3,439 |
| Safe | > 2.0 | $100.3M | $2.9M | $97.5M | +93.1% | 14,780 |
| Total | $406.0M | $140.3M | $265.7M | +4.0% | 23,086 |
As BNB, BTC and ETH rose, uncorrelated debt moved to higher health factors. Uncorrelated debt within 10% of liquidation fell to $1.3M (August: $1.8M).
Stablecoin debt by collateral (seven largest legs, $179.1M of the $190.6M market-level stablecoin debt):
| Collateral | Stablecoin Debt | Aug Debt | MoM | Within 10% of Liquidation |
|---|---|---|---|---|
| BTCB | $84.1M | $78.6M | +7.0% | $6.6M |
| SolvBTC | $37.7M | $40.0M | -5.8% | ~$0 |
| BNB | $27.6M | $27.8M | -0.7% | $0.1M |
| wBETH | $11.5M | $10.5M | +9.4% | ~$0 |
| ETH | $8.0M | $8.4M | -4.8% | ~$0 |
| USDT | $7.5M | $5.3M | +40.2% | $3.3M |
| asBNB | $2.7M | $1.7M | +58.1% | ~$0 |
Stablecoin debt backed by BTCB and within 10% of liquidation rose in September from $2.3M to $6.6M. Most of the increase comes from one account at a health factor of 1.08, which has $22.9M of debt against BTCB, $5.1M of it in USDT. Separately, $3.3M of the $7.5M borrowed against USDT collateral is within 10% of liquidation. With stablecoins on both sides, the main risk for those positions is a depeg.
Forward stress test:
The stress test applies a further price shock to every account. In the uniform case, all volatile collateral and debt move together, with stablecoins held at $1.
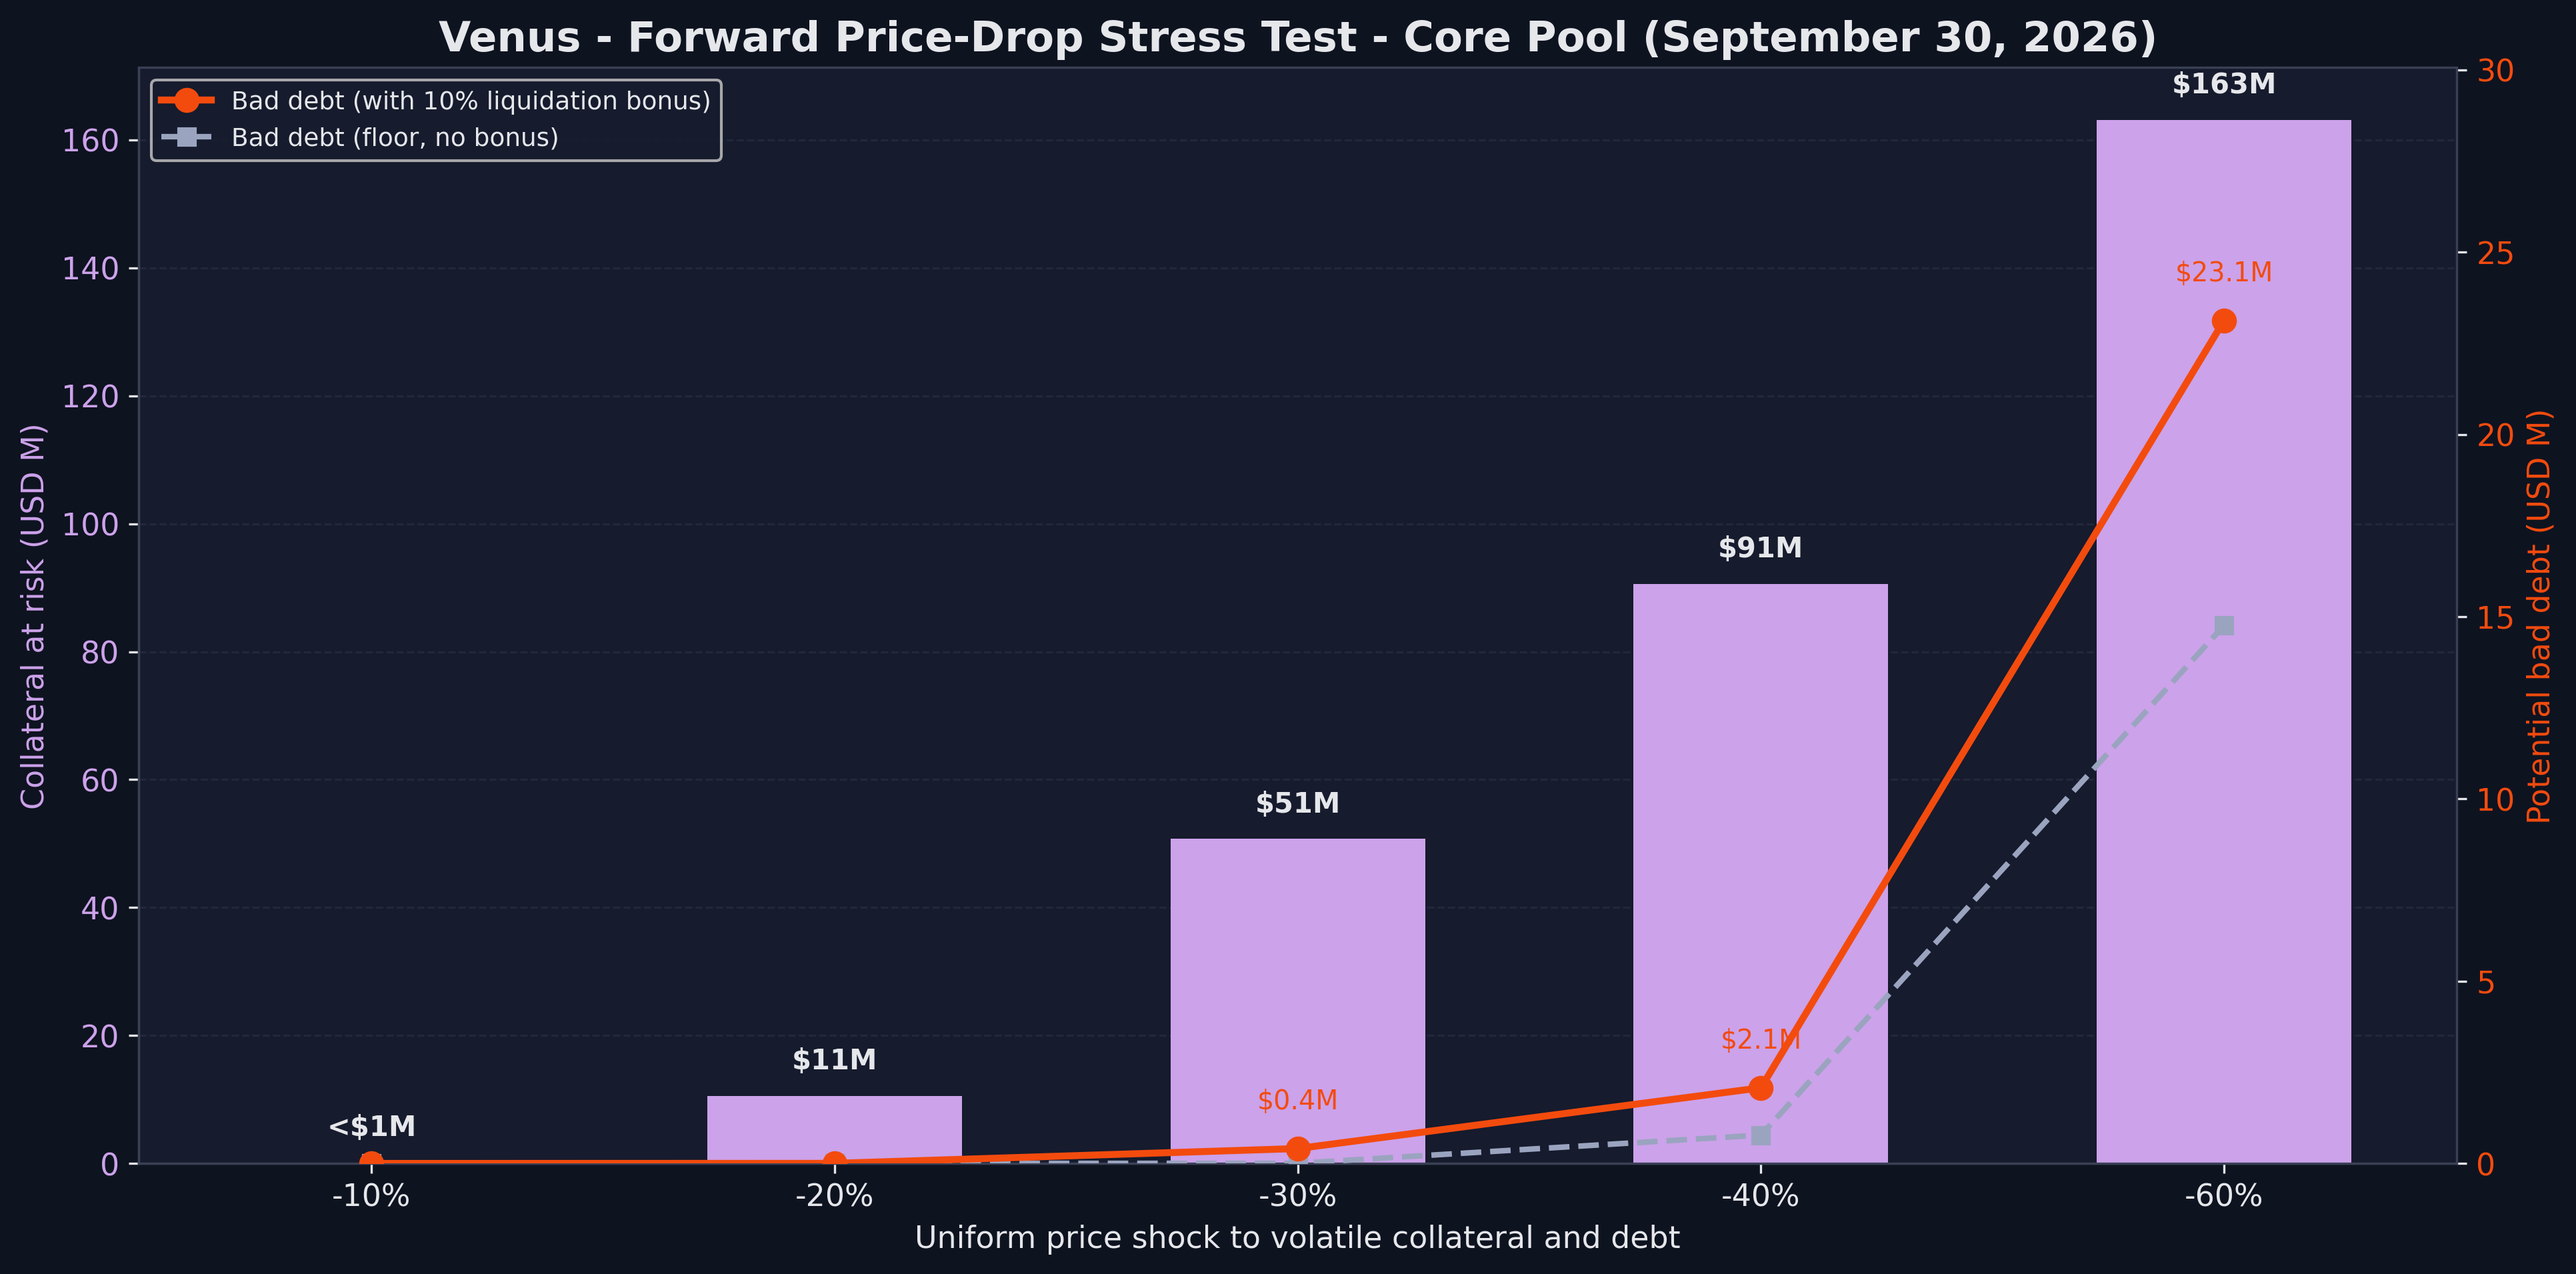
Forward Price-Drop Stress Test
| Further price shock | Accounts liquidated | Collateral at risk | Aug 31 collateral at risk | Collateral-at-risk MoM | Bad debt (+10% bonus) | Aug 31 bad debt |
|---|---|---|---|---|---|---|
| No shock (baseline) | 4,677 | $0.05M | $0.04M | n/m | ~$0 | ~$0 |
| -10% | 4,639 | $0.1M | $0.04M | n/m | ~$0 | ~$0 |
| -20% | 4,682 | $10.5M | $11.3M | -6.3% | ~$0 | ~$0 |
| -30% | 4,905 | $50.7M | $23.4M | +116.6% | $0.4M | $0.7M |
| -40% | 5,811 | $90.6M | $67.8M | +33.7% | $2.1M | $2.4M |
| -60% | 7,598 | $163.2M | $152.1M | +7.2% | $23.1M | $26.5M |
Modeled bad debt is lower than in August at every level from -30% down. The largest single account at -30% is the BTCB borrower at health factor 1.08 ($21.7M of collateral).
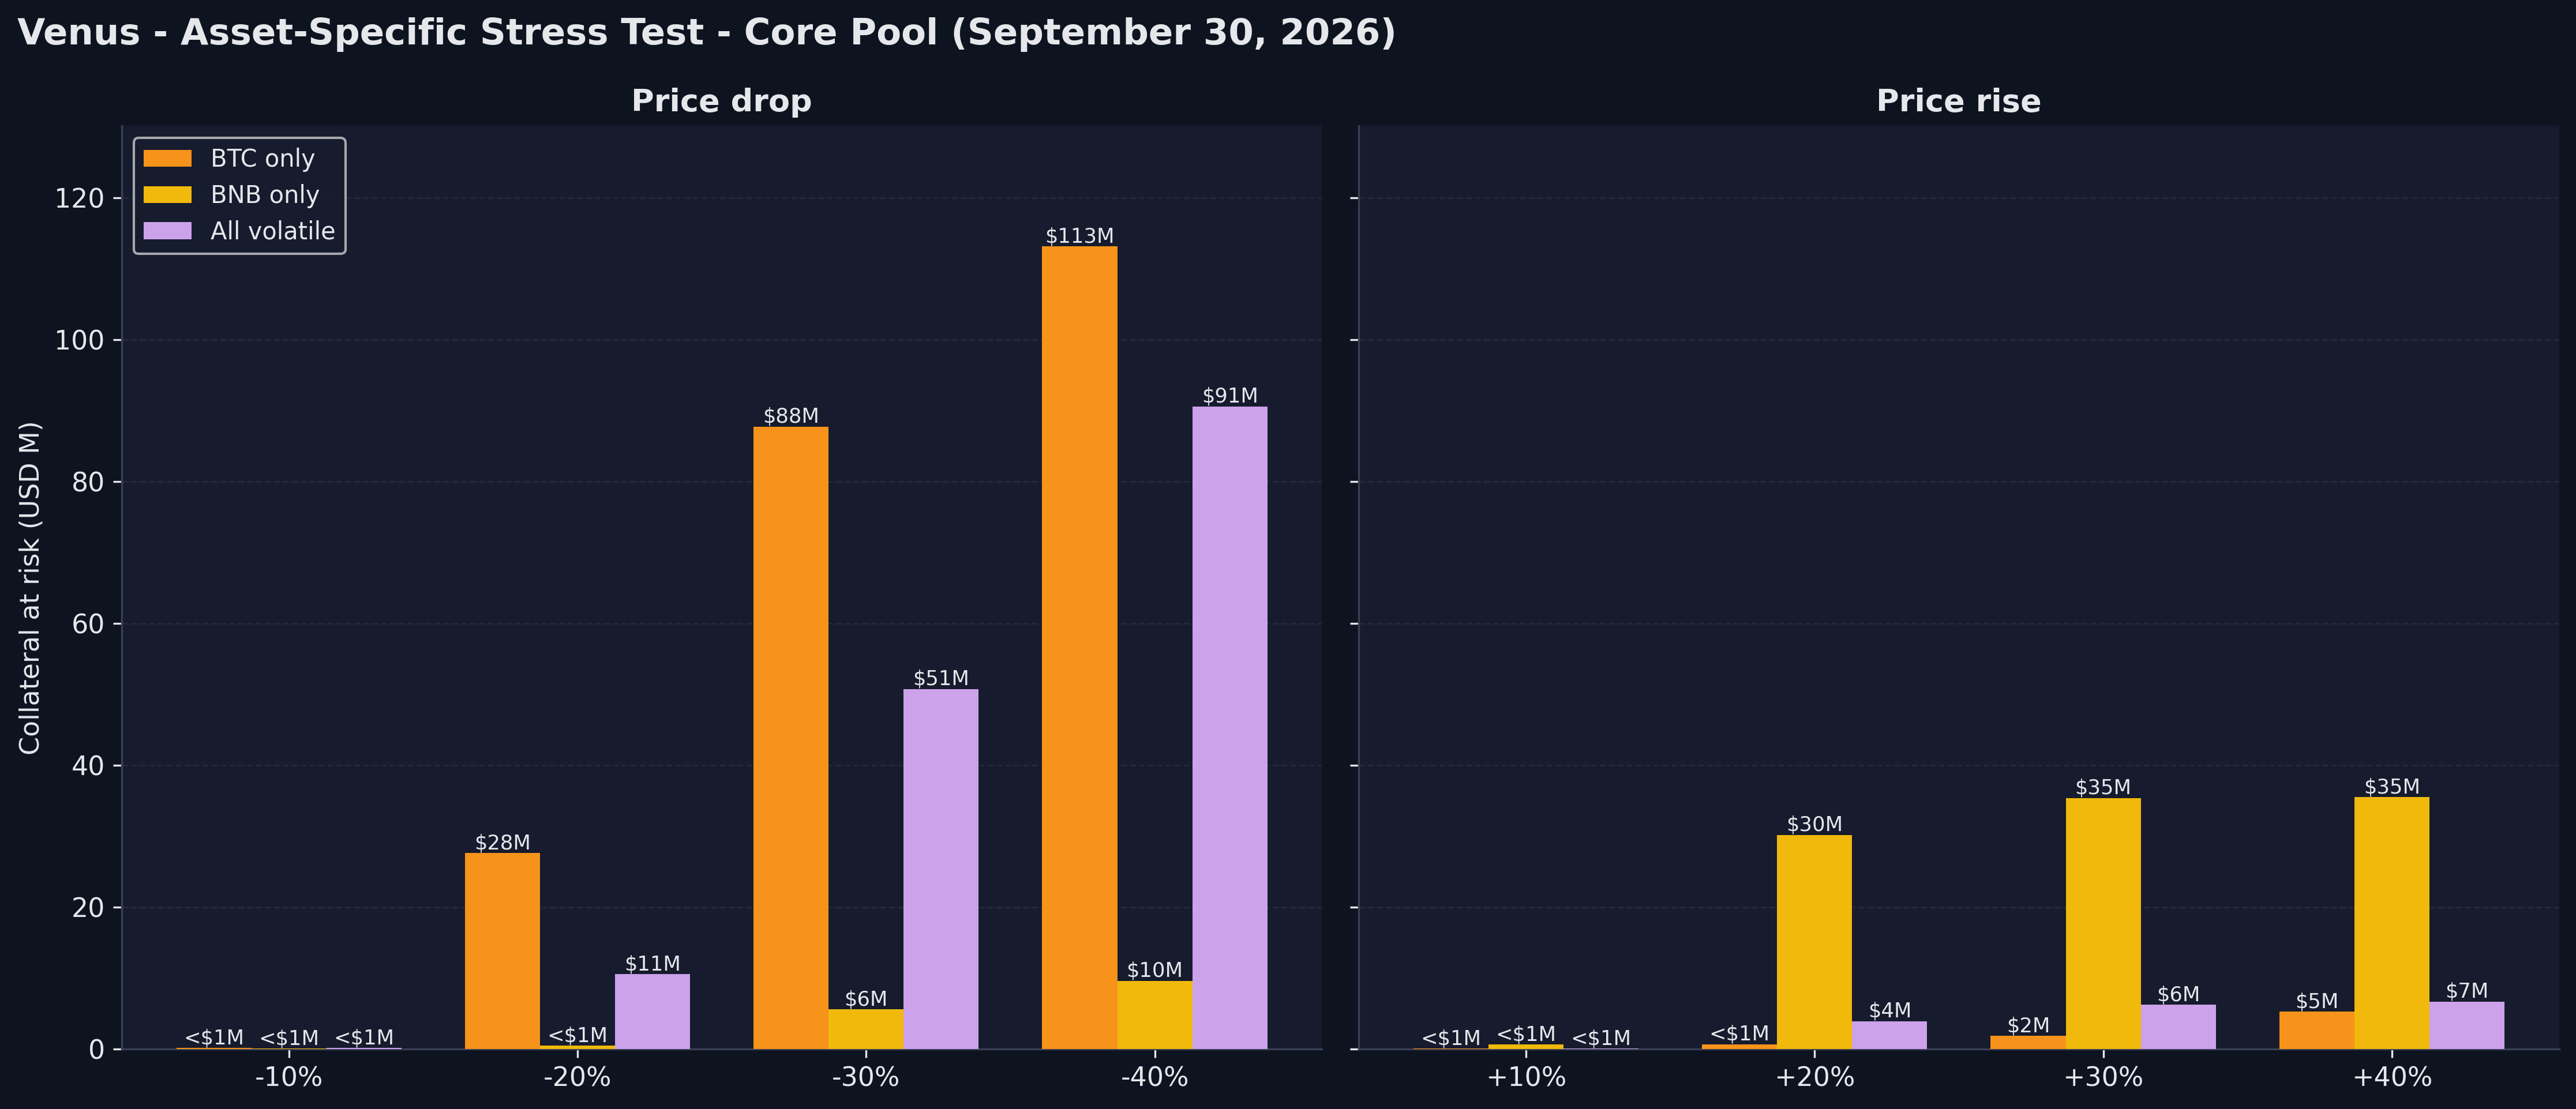
Asset-Specific Stress Test
| Scenario | -10% | -20% | -30% | -40% |
|---|---|---|---|---|
| BTC only | $0.1M | $27.6M | $87.7M | $113.1M |
| BNB only | ~$0 | $0.5M | $5.6M | $9.6M |
| All volatile | $0.1M | $10.5M | $50.7M | $90.6M |
| Scenario | +10% | +20% | +30% | +40% |
|---|---|---|---|---|
| BNB only | $0.6M | $30.2M | $35.4M | $35.5M |
| BTC only | $0.1M | $0.6M | $1.8M | $5.2M |
| All volatile | $0.1M | $3.9M | $6.2M | $6.7M |
As some large accounts borrow BNB against BTC, BNB rising relative to BTC puts more collateral at risk than both moving together. A 20% BTC-only drop puts $27.6M at risk and a 20% BNB-only rise puts $30.2M, against $10.5M and $3.9M when all volatile assets move together. One account that borrows BNB against BTCB and stablecoins accounts for $24.4M and $29.3M of those totals.
Top borrowers and borrower concentration:
| Borrower | Total Debt | MoM | Primary Asset |
|---|---|---|---|
| 0xc482…82a8 | $33.0M | +24.2% | BTCB |
| 0x9614…8bf1 | $22.9M | +6.4% | BTCB, USDT |
| 0x5c18…fe77 | $20.3M | -50.2% | BNB |
| 0x3e87…d90c | $16.8M | -67.8% | BNB |
The four largest borrowers hold $93.0M, 22.9% of protocol debt (August: $140.8M, 32%). The two BNB borrowers reduced their BNB debt from 134,220 to 47,915 BNB, $92.7M to $36.8M.
4. Collateral Structure
Top collateral/borrow pairs:
| Collateral | Borrowed | Debt | Aug Debt | MoM | Users |
|---|---|---|---|---|---|
| BTCB | USDT | $64.2M | $60.7M | +5.8% | 2,181 |
| SolvBTC | BTCB | $39.4M | $35.4M | +11.3% | 21 |
| xSolvBTC | BTCB | $37.7M | $33.6M | +12.3% | 12 |
| SolvBTC | USDT | $33.4M | $35.8M | -6.7% | 41 |
| BTCB | BTCB | $30.2M | $34.0M | -11.2% | 603 |
| BTCB | BNB | $26.9M | $33.2M | -19.0% | 1,856 |
| BTCB | ETH | $17.4M | $2.0M | +764.1% | 353 |
BTCB borrowed against SolvBTC and xSolvBTC grew 11% to 12%. BNB borrowed against BTCB fell 19%, and ETH borrowed against BTCB is now one of the top pairs.
5. Utilization
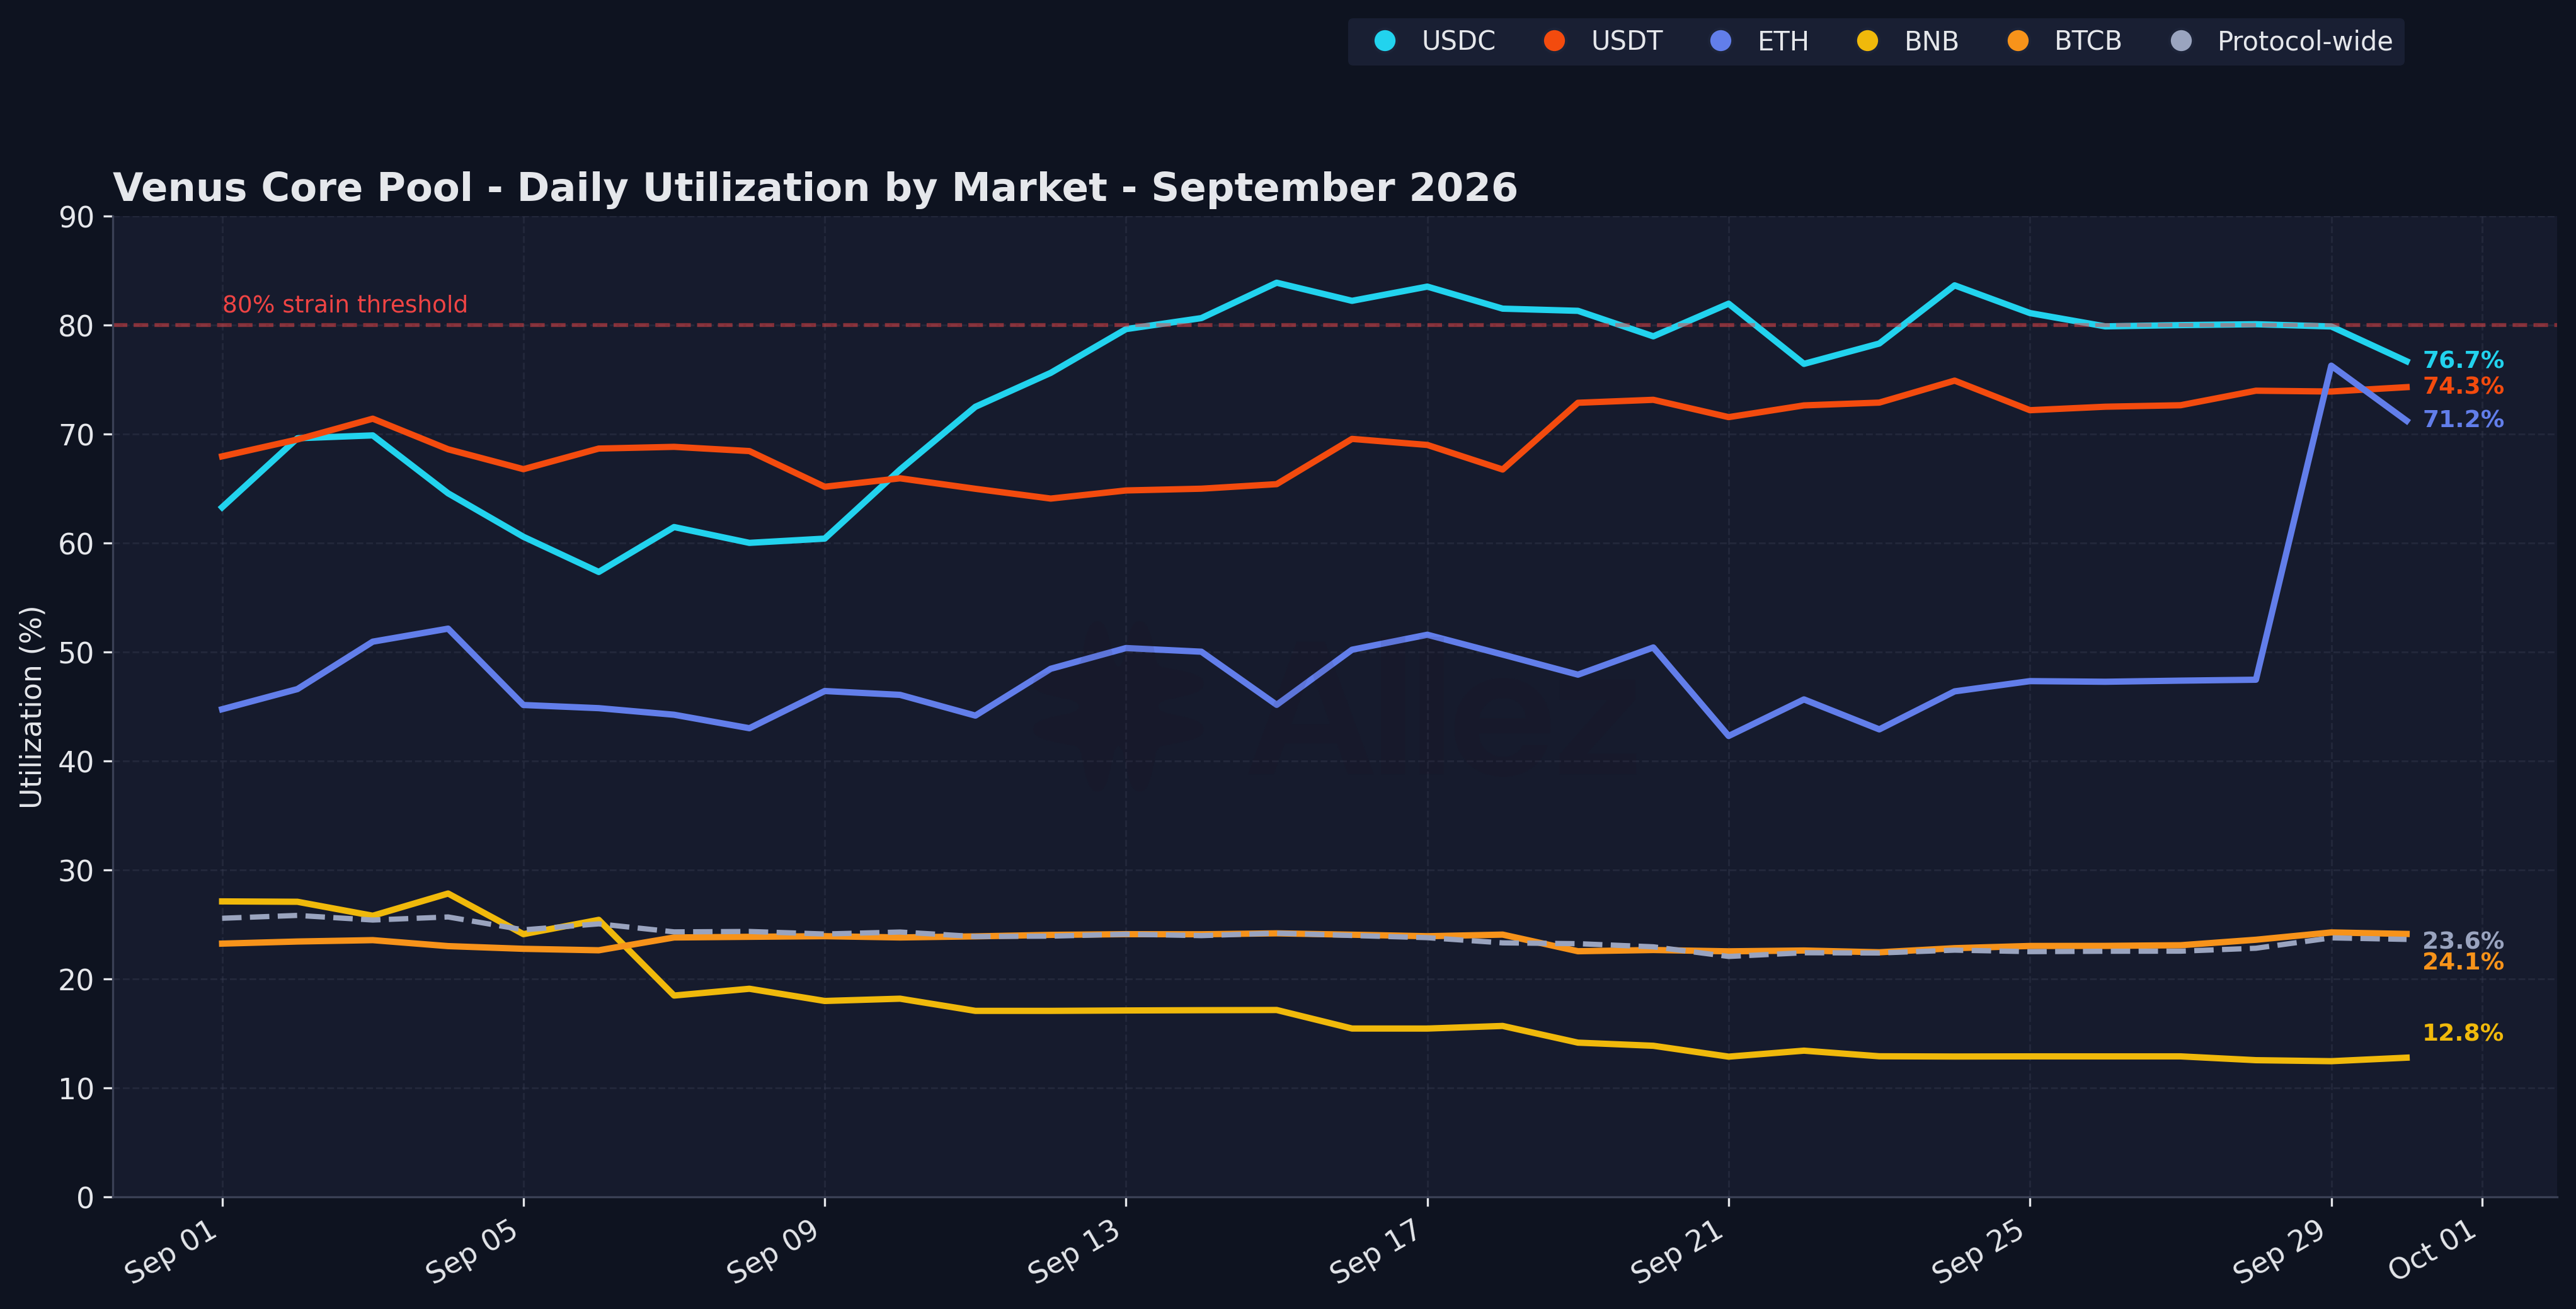
Utilization by Market
Protocol utilization eased from 25.9% to 23.6% as BNB borrowing fell (BNB utilization 29.2% to 12.8%). Stablecoin borrowing demand stayed strong: USDC was above 80% on 11 days, peaking at 83.9% on September 15, and closed at 76.7%. USDT closed at 74.3%. ETH utilization rose from 47.5% on September 28 to 76.3% on September 29, when 33 accounts, most of them new ETH borrowers, added $13.7M of ETH debt, $8.7M of it against BTCB. It closed the month at 71.2%.
6. Summary & Forward Look
Across September, position health materially improved in aggregate. Supply grew with tailwinds from appreciating BNB, BTC and ETH despite a modest deleveraging. Looking ahead, the protocol continues to produce opportunities for market participants including more fixed rate vaults, as well as continued expansion of the liquidity hub. From a risk perspective, the areas to watch are uncorrelated price movements between BTC and BNB which could push several large accounts to unwind.
August’s watch items all improved: the four largest borrowers now hold 22.9% of debt (August: 32%), BNB debt fell $59.8M, and correlated debt within 10% of liquidation eased to $38.6M from $43.5M.
Things to watch in October:
- BTC-only downside. $87.7M of collateral is at risk at a 30% BTC-only drop, against $50.7M in the uniform case.
- BNB upside. $30.2M of collateral is at risk after a 20% BNB rise with other prices held. BNB rose 17.8% in August and 11.3% in September.
- Stablecoin and ETH utilization. USDC spent 11 days above 80% and ETH utilization reached 76.3%. VIP-664’s ETH E-mode group could add wBETH-backed ETH borrowing on top of that.
Readers can follow current Venus market and risk metrics on the Allez Venus Risk Dashboard.
Appendix: Asset Category Classification
| Category | Assets | Supply | Debt |
|---|---|---|---|
| BTC | BTCB, SolvBTC, xSolvBTC | $752.9M | $113.8M |
| BNB | BNB, WBNB, asBNB, slisBNB, PT-clisBNB | $541.9M | $63.9M |
| Stablecoins | USDT, USDC, U, USDe, sUSDe, lisUSD, FDUSD, DAI, USD1, BUSD, vhU, vhUSDT | $263.0M | $190.6M |
| ETH | ETH, wBETH, BETH | $79.5M | $35.4M |
| Altcoins | Cake, XRP, DOGE, ADA, DOT, FIL, LINK, UNI, AAVE, LTC, BCH, TRX, MATIC, THE, TWT, XVS, SOL | $79.7M | $2.3M |
| RWA | NVDAB, TSLAB, SPCXB, SKHYB (bStocks), XAUM (gold) | $0.7M | $0.0M |
Correlated positions hold collateral and debt in the same category (SolvBTC/BTCB, asBNB/BNB); uncorrelated positions borrow across categories and carry directional price exposure. The classification is account-level and does not measure e-mode enrollment.
Scope: Venus Core Pool on BNB Chain only.
This report represents independent risk analysis by Allez Labs for the Venus community.