Summary
Venus BNB Core Pool grew to $1.41B in supply (+5.9% MoM) and $380M in debt (+4.1%) over the course of July. The growth was price-led as BNB, BTC and ETH all rose while token balances on Venus stayed roughly flat. Stablecoins however, were a segment of outflow, down $17M.
With very little volatility in comparison to past months, only $450K of collateral was liquidated (-89% versus June). VIP-642 executed on July 12, zeroing the liquidation threshold on eight deprecated Core Pool markets. As of the end of July, the protocol has $44.4M of debt within 10% of liquidation, of which only $3.5M is exposed to price volatility, with the other $40.9M in correlated pairs.
Venus has also expanded its RWA offering in July through tokenized-stock collateral, institutional custody access, and the maturity of its first XAUm-backed fixed-term USDT vault.
1. Market Context & BNB Price
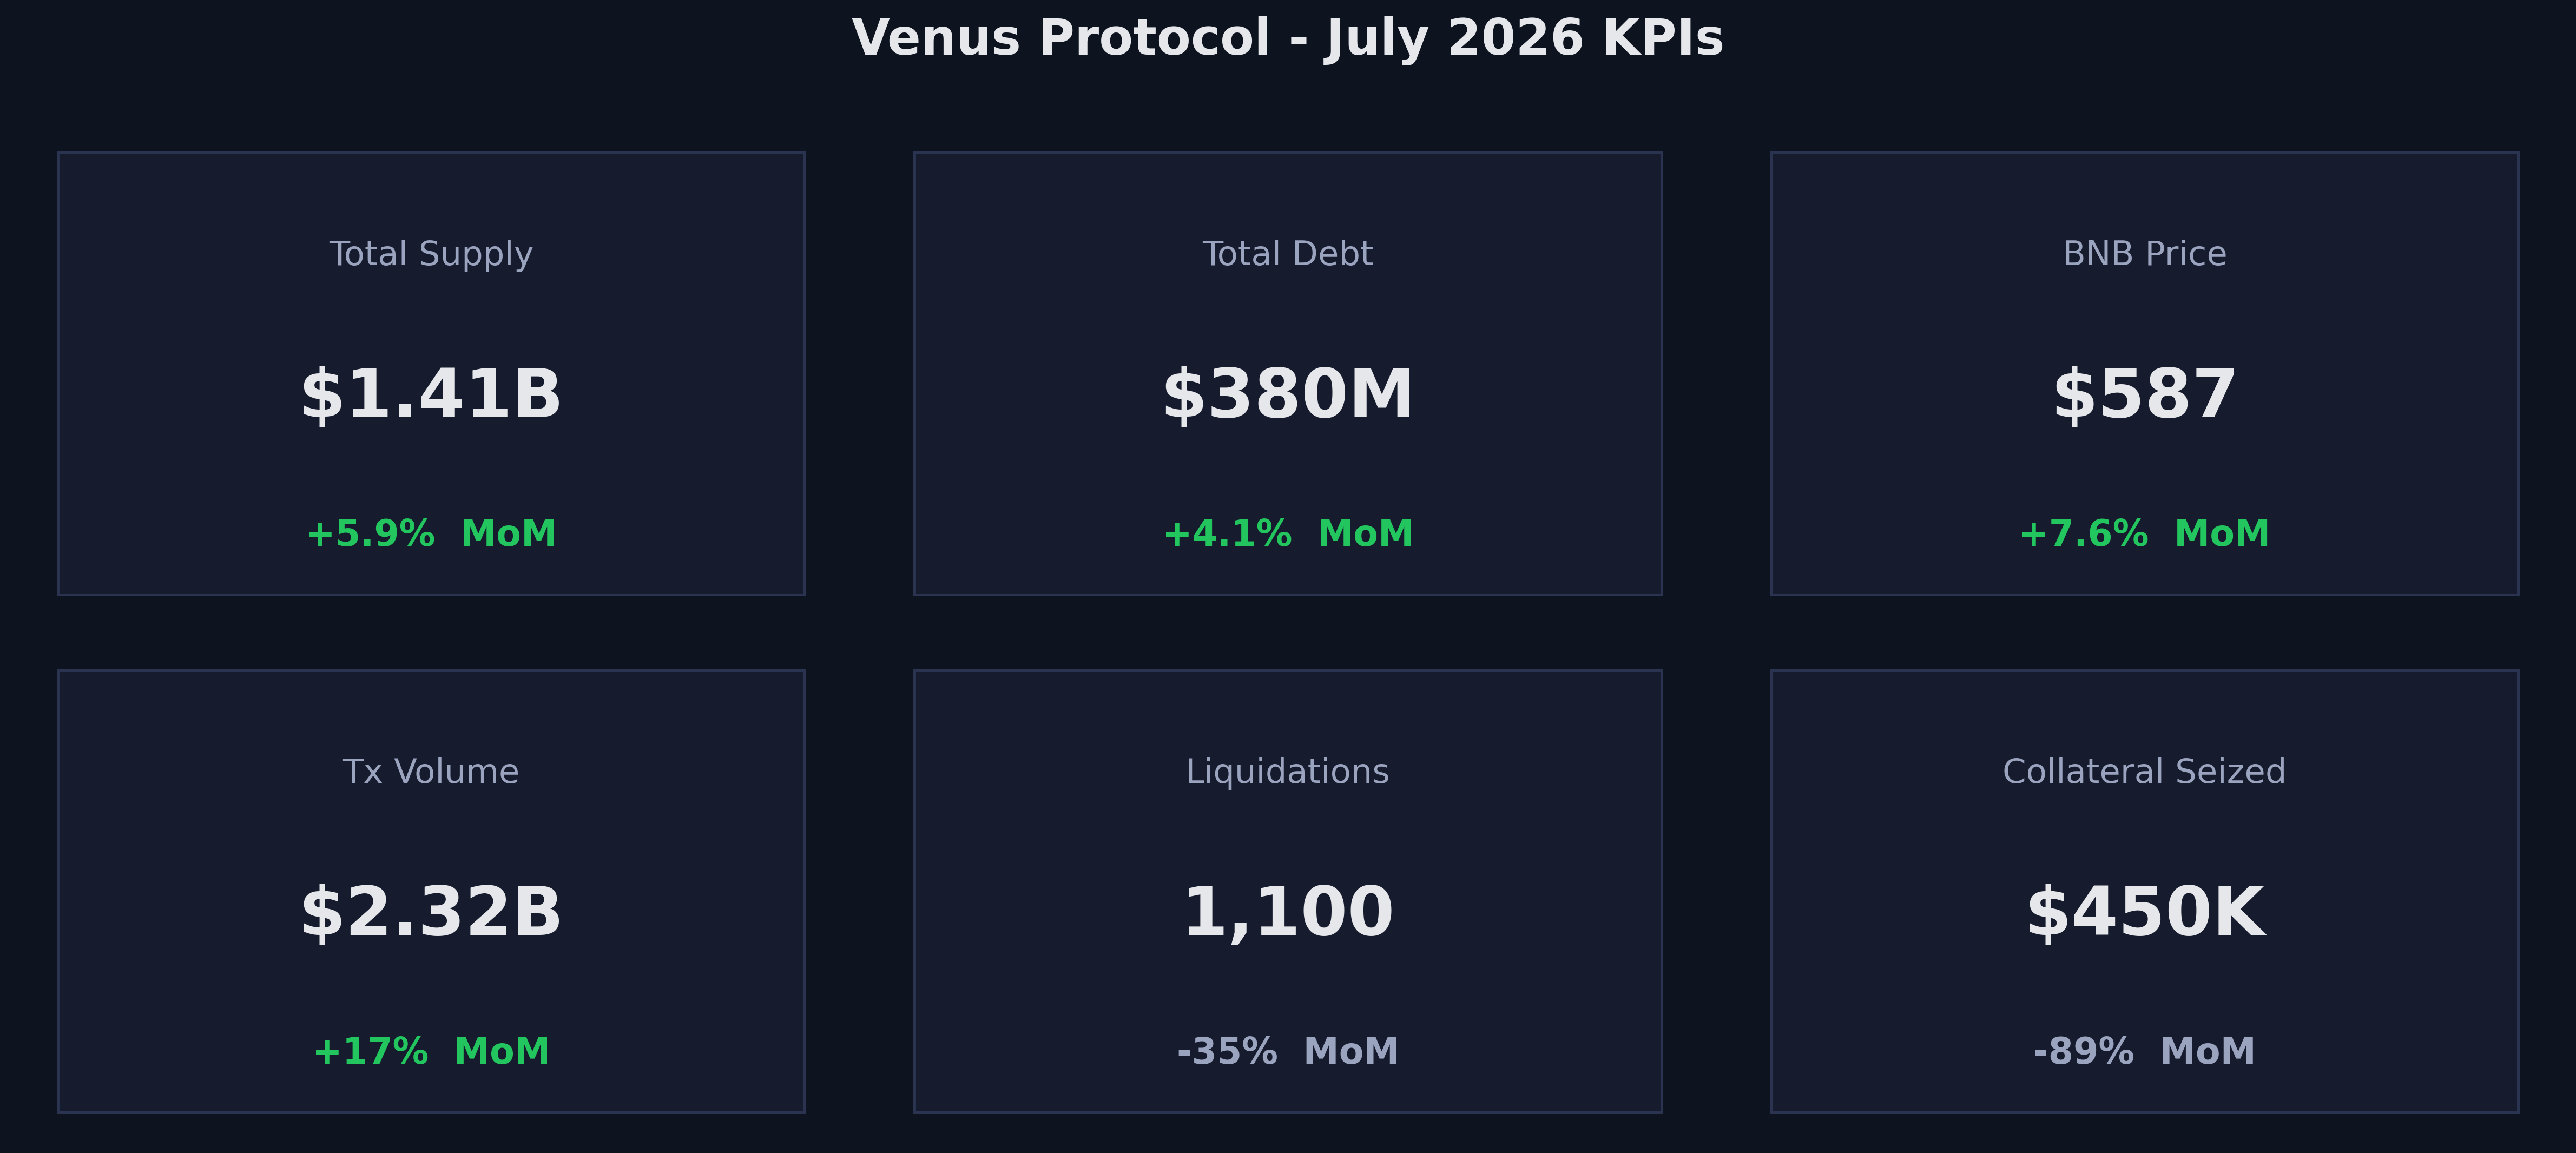
KPI Summary
- Total Supply: $1.41B (+5.9% MoM)
- Total Debt: $380M (+4.1% MoM)
- BNB Price: $587 (+7.6% MoM)
- Liquidations: 1,100 events (-35% MoM)
- Collateral Seized: $450K (-89% MoM)
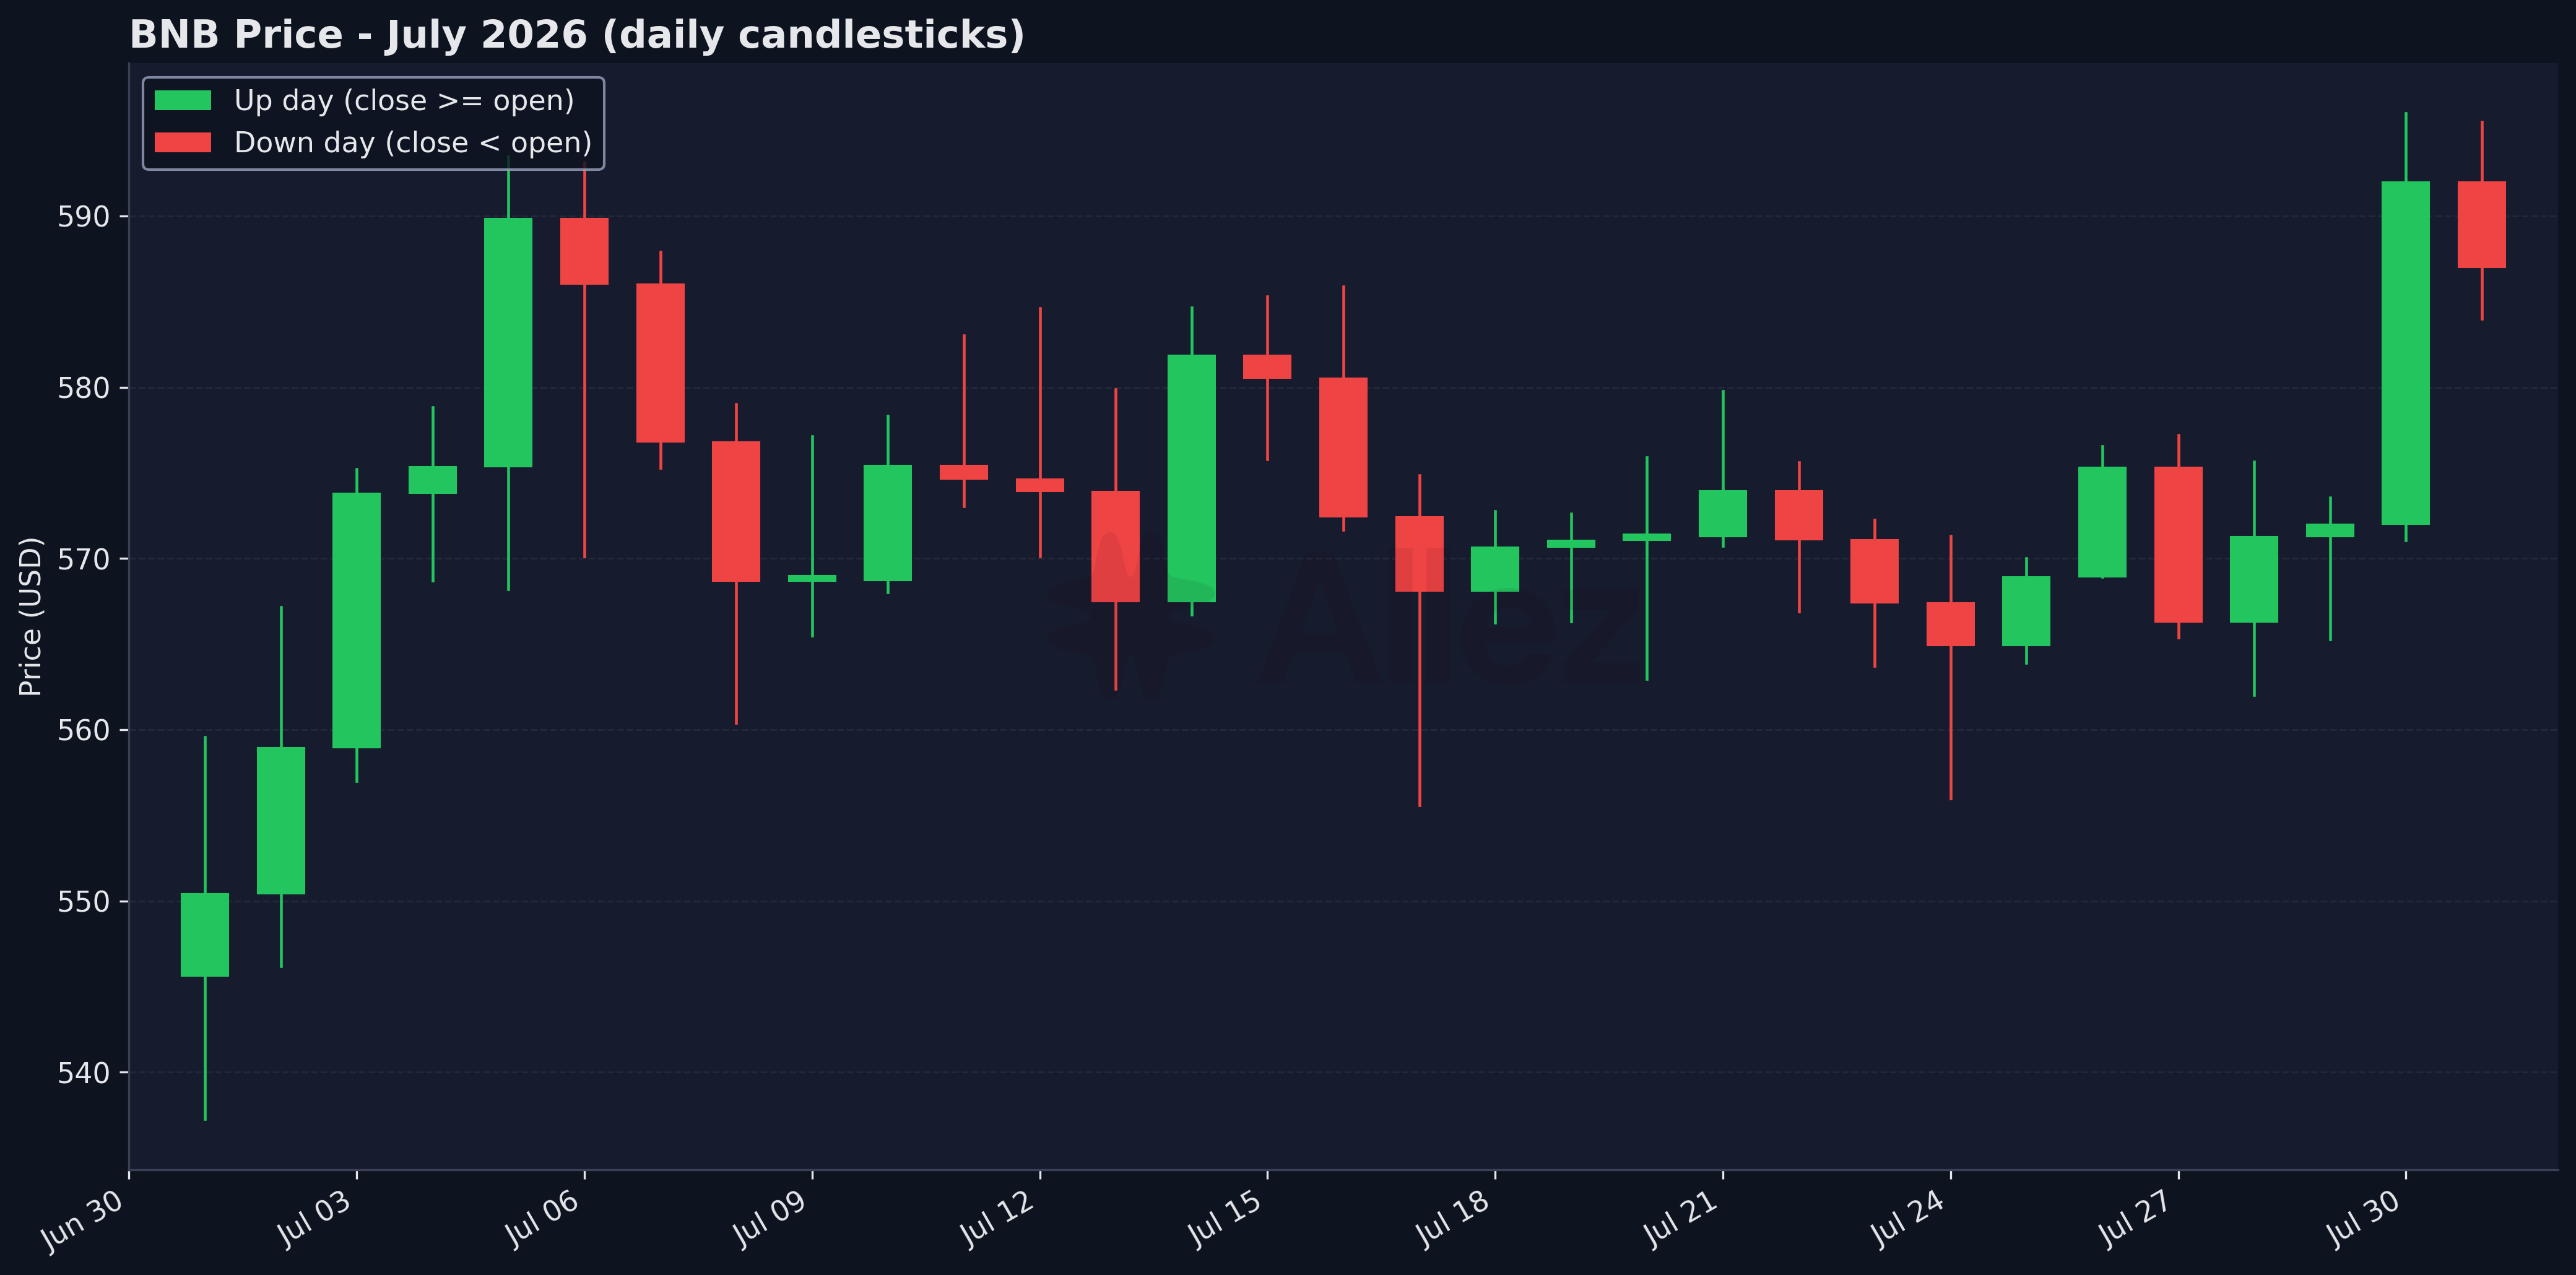
BNB Price - July 2026 (daily candlesticks)
BNB had a strong July, opening at $546 and holding a tight range between $537 and $596 before finishing up 7.6% at $587. This stability reflected larger market trends, being comparatively calm compared to previous months.
Venus Ecosystem Updates:
- RWA and tokenized stocks. Venus’s tokenized-equity rollout is drawing its real deposits. Building on the XAUm gold market, Venus added tokenized stocks (bStocks) as Core Pool collateral through July, with SKHYB (SK Hynix) listed mid-month. Late-July incentive campaigns and repeated supply-cap raises pulled in deposits that land in early August: SKHYB grew to about $700k across 38 suppliers by the end of July.
- Institutional access. A Cactus Custody partnership (July 1) lets custody clients reach Venus markets, including RWA collateral like XAUm gold, without leaving their custody setup.
- Fixed-term vault. The first fixed-term USDT vault, backed by XAUm, matured July 17 at a 5.4% fixed supply rate.
2. Supply & Market Overview
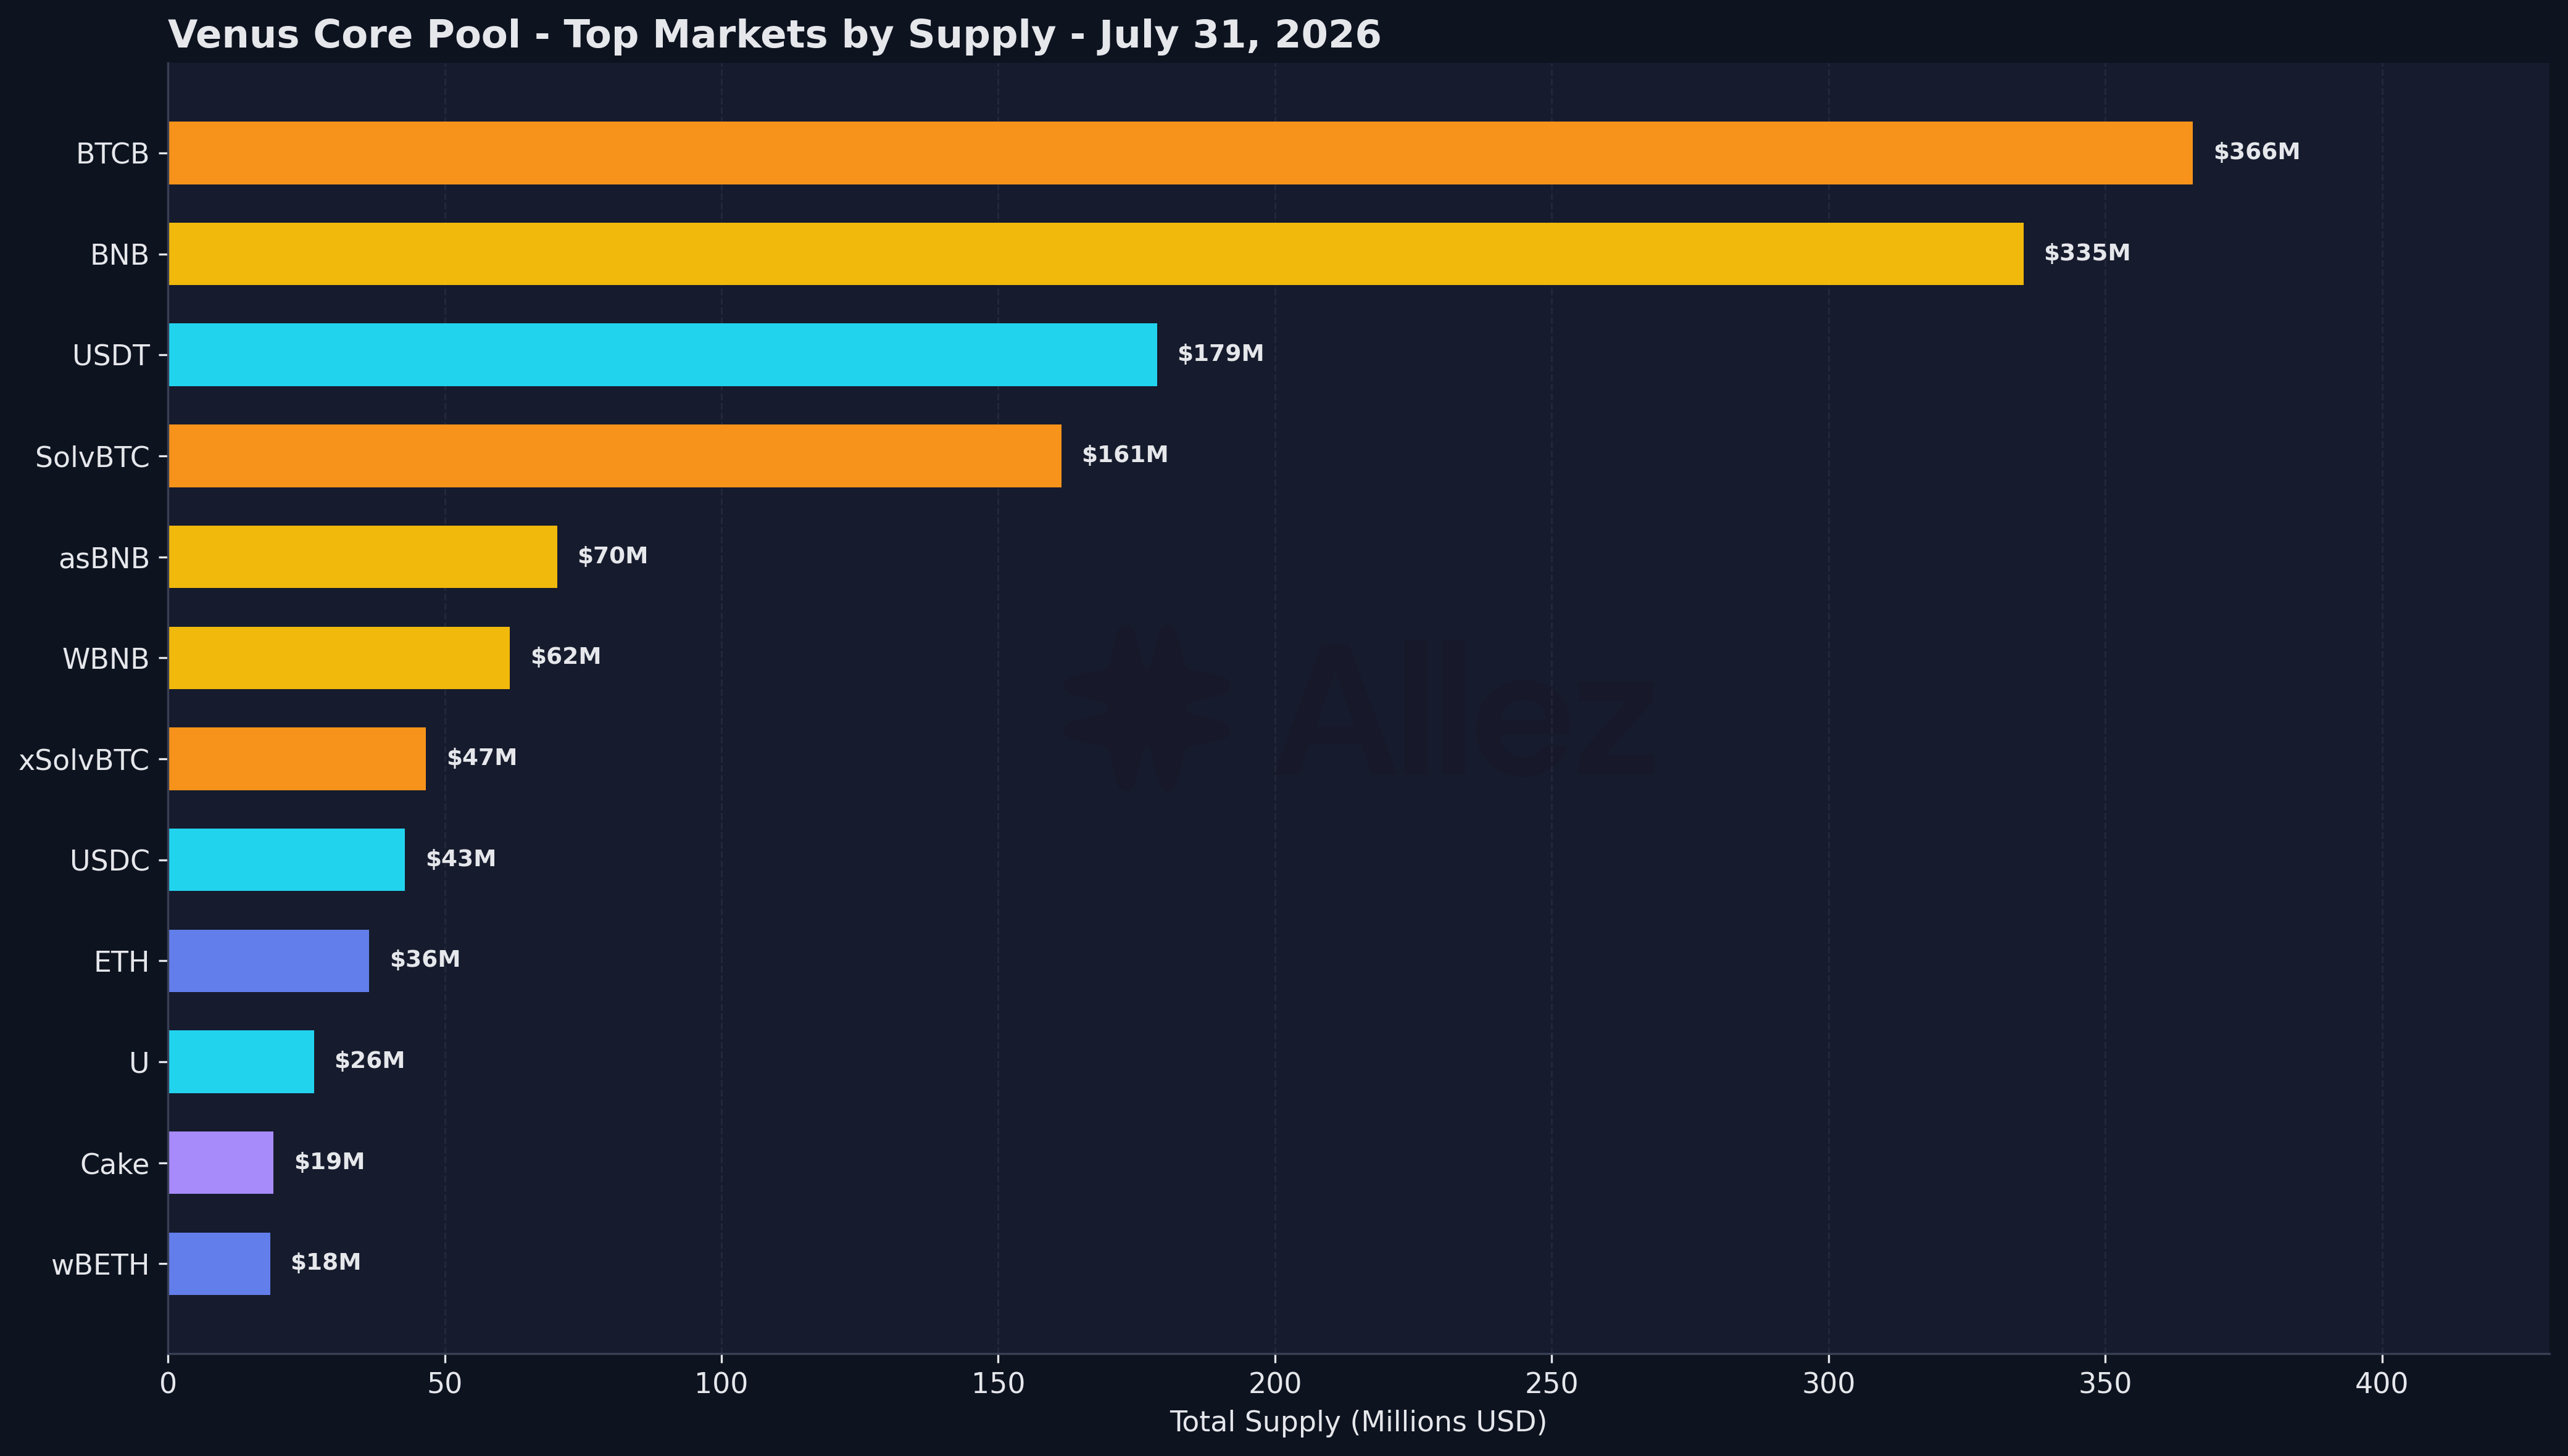
Supply by Market
Top markets by supply (July 31, 2026):
| Market | Supply | MoM | Debt | Utilization |
|---|---|---|---|---|
| BTCB | $365.9M | +9.2% | $96.6M | 26.4% |
| BNB | $335.2M | +8.3% | $90.6M | 27.0% |
| USDT | $178.7M | -6.9% | $113.4M | 63.5% |
| SolvBTC | $161.4M | +9.0% | $0.1M | 0.1% |
| asBNB | $70.3M | +6.7% | $0.0M | 0.0% |
| WBNB | $61.8M | +10.3% | $10.3M | 16.7% |
| xSolvBTC | $46.6M | +7.3% | $0.0M | 0.0% |
| USDC | $42.8M | -8.0% | $29.2M | 68.2% |
| ETH | $36.3M | +18.8% | $20.5M | 56.5% |
| U | $26.4M | -0.4% | $11.5M | 43.8% |
BTCB and BNB added roughly $31M and $26M of supply, primarily off the back of underlying price action: BTCB balances grew about 1.6% in token terms (roughly 5,720 to 5,820 BTCB) against a 7.4% BTC gain, and BNB token balances were stable against a 7.6% price gain.
Stablecoins were the only category to shrink, with USDT down $13M and USDC down $4M.
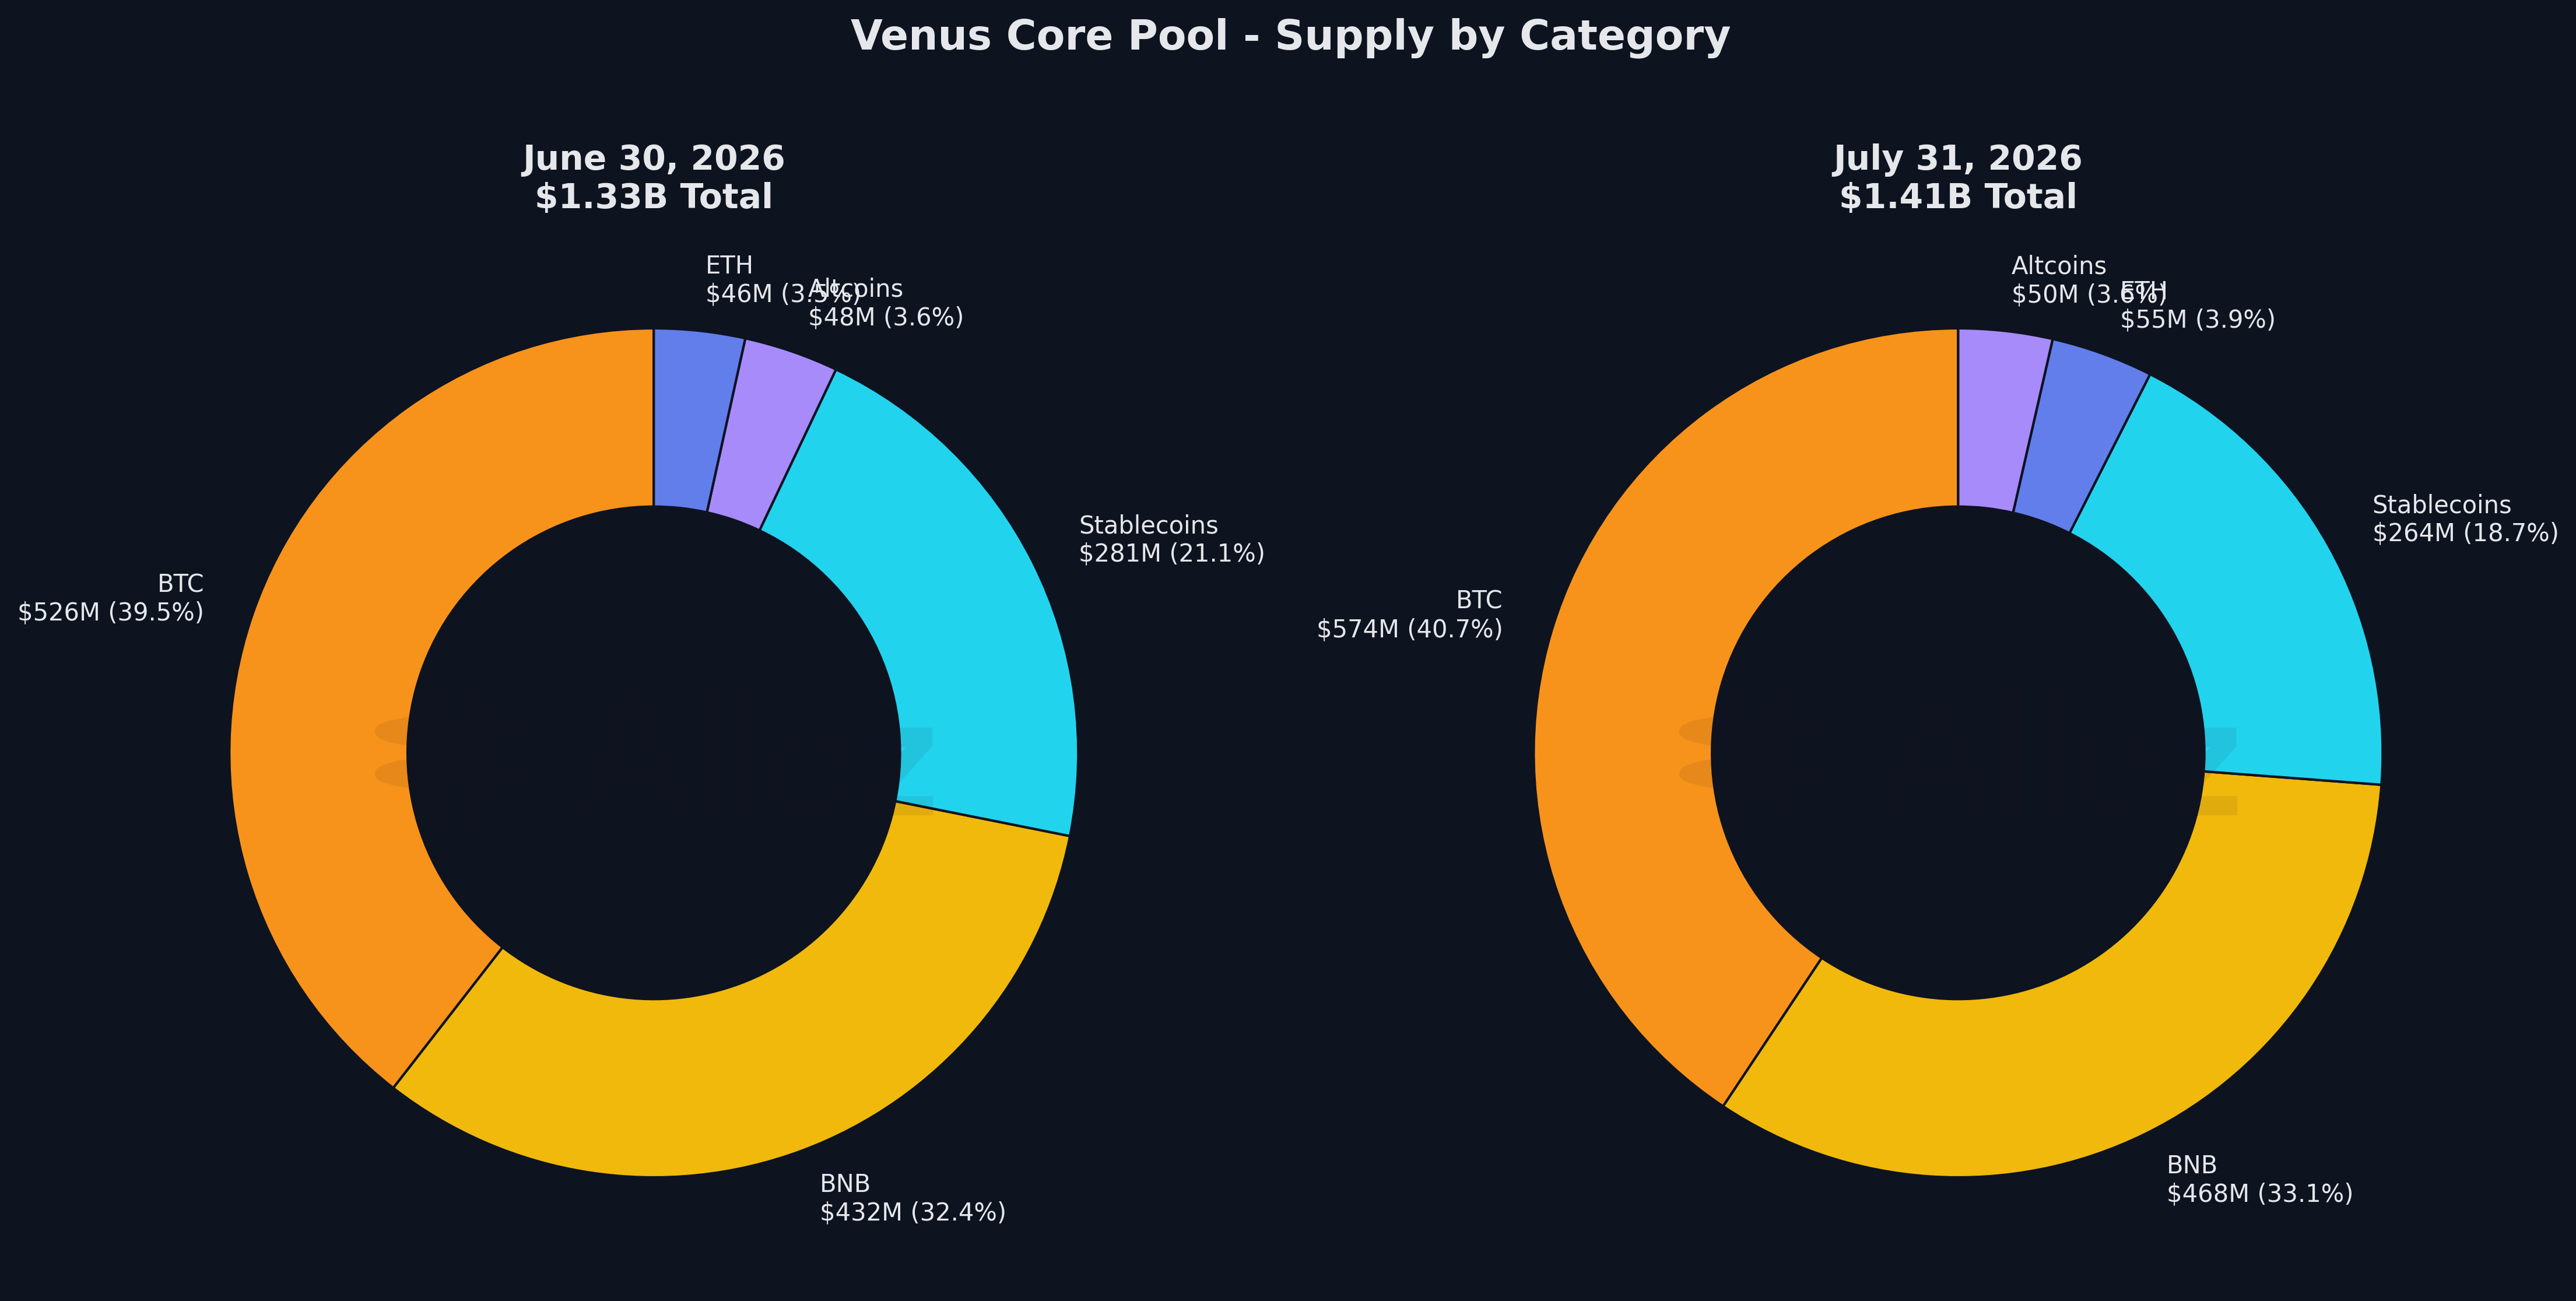
Category Composition
Category composition (July 31, 2026):
| Category | Supply | Share | MoM | Debt |
|---|---|---|---|---|
| BTC | $573.9M | 40.7% | +9.0% | $96.7M |
| BNB | $467.8M | 33.1% | +8.4% | $100.9M |
| Stablecoins | $264.4M | 18.7% | -5.9% | $159.8M |
| ETH | $54.9M | 3.9% | +19.1% | $20.9M |
| Altcoins | $50.5M | 3.6% | +5.1% | $1.6M |
BTC-backed collateral (BTCB, SolvBTC, xSolvBTC) remains the single largest category of deposits on BNB Core at 40.7% of supply, ahead of BNB-family assets at 33.1%. ETH posted the biggest percentage gain (+19.1%). Stablecoins remain 18.7% of supply after their share declined about 2 points following the USDT and USDC outflows. They account for $159.8M of debt, 42% of all protocol borrowing, consistent with stablecoins being the primary asset borrowed against crypto collateral.
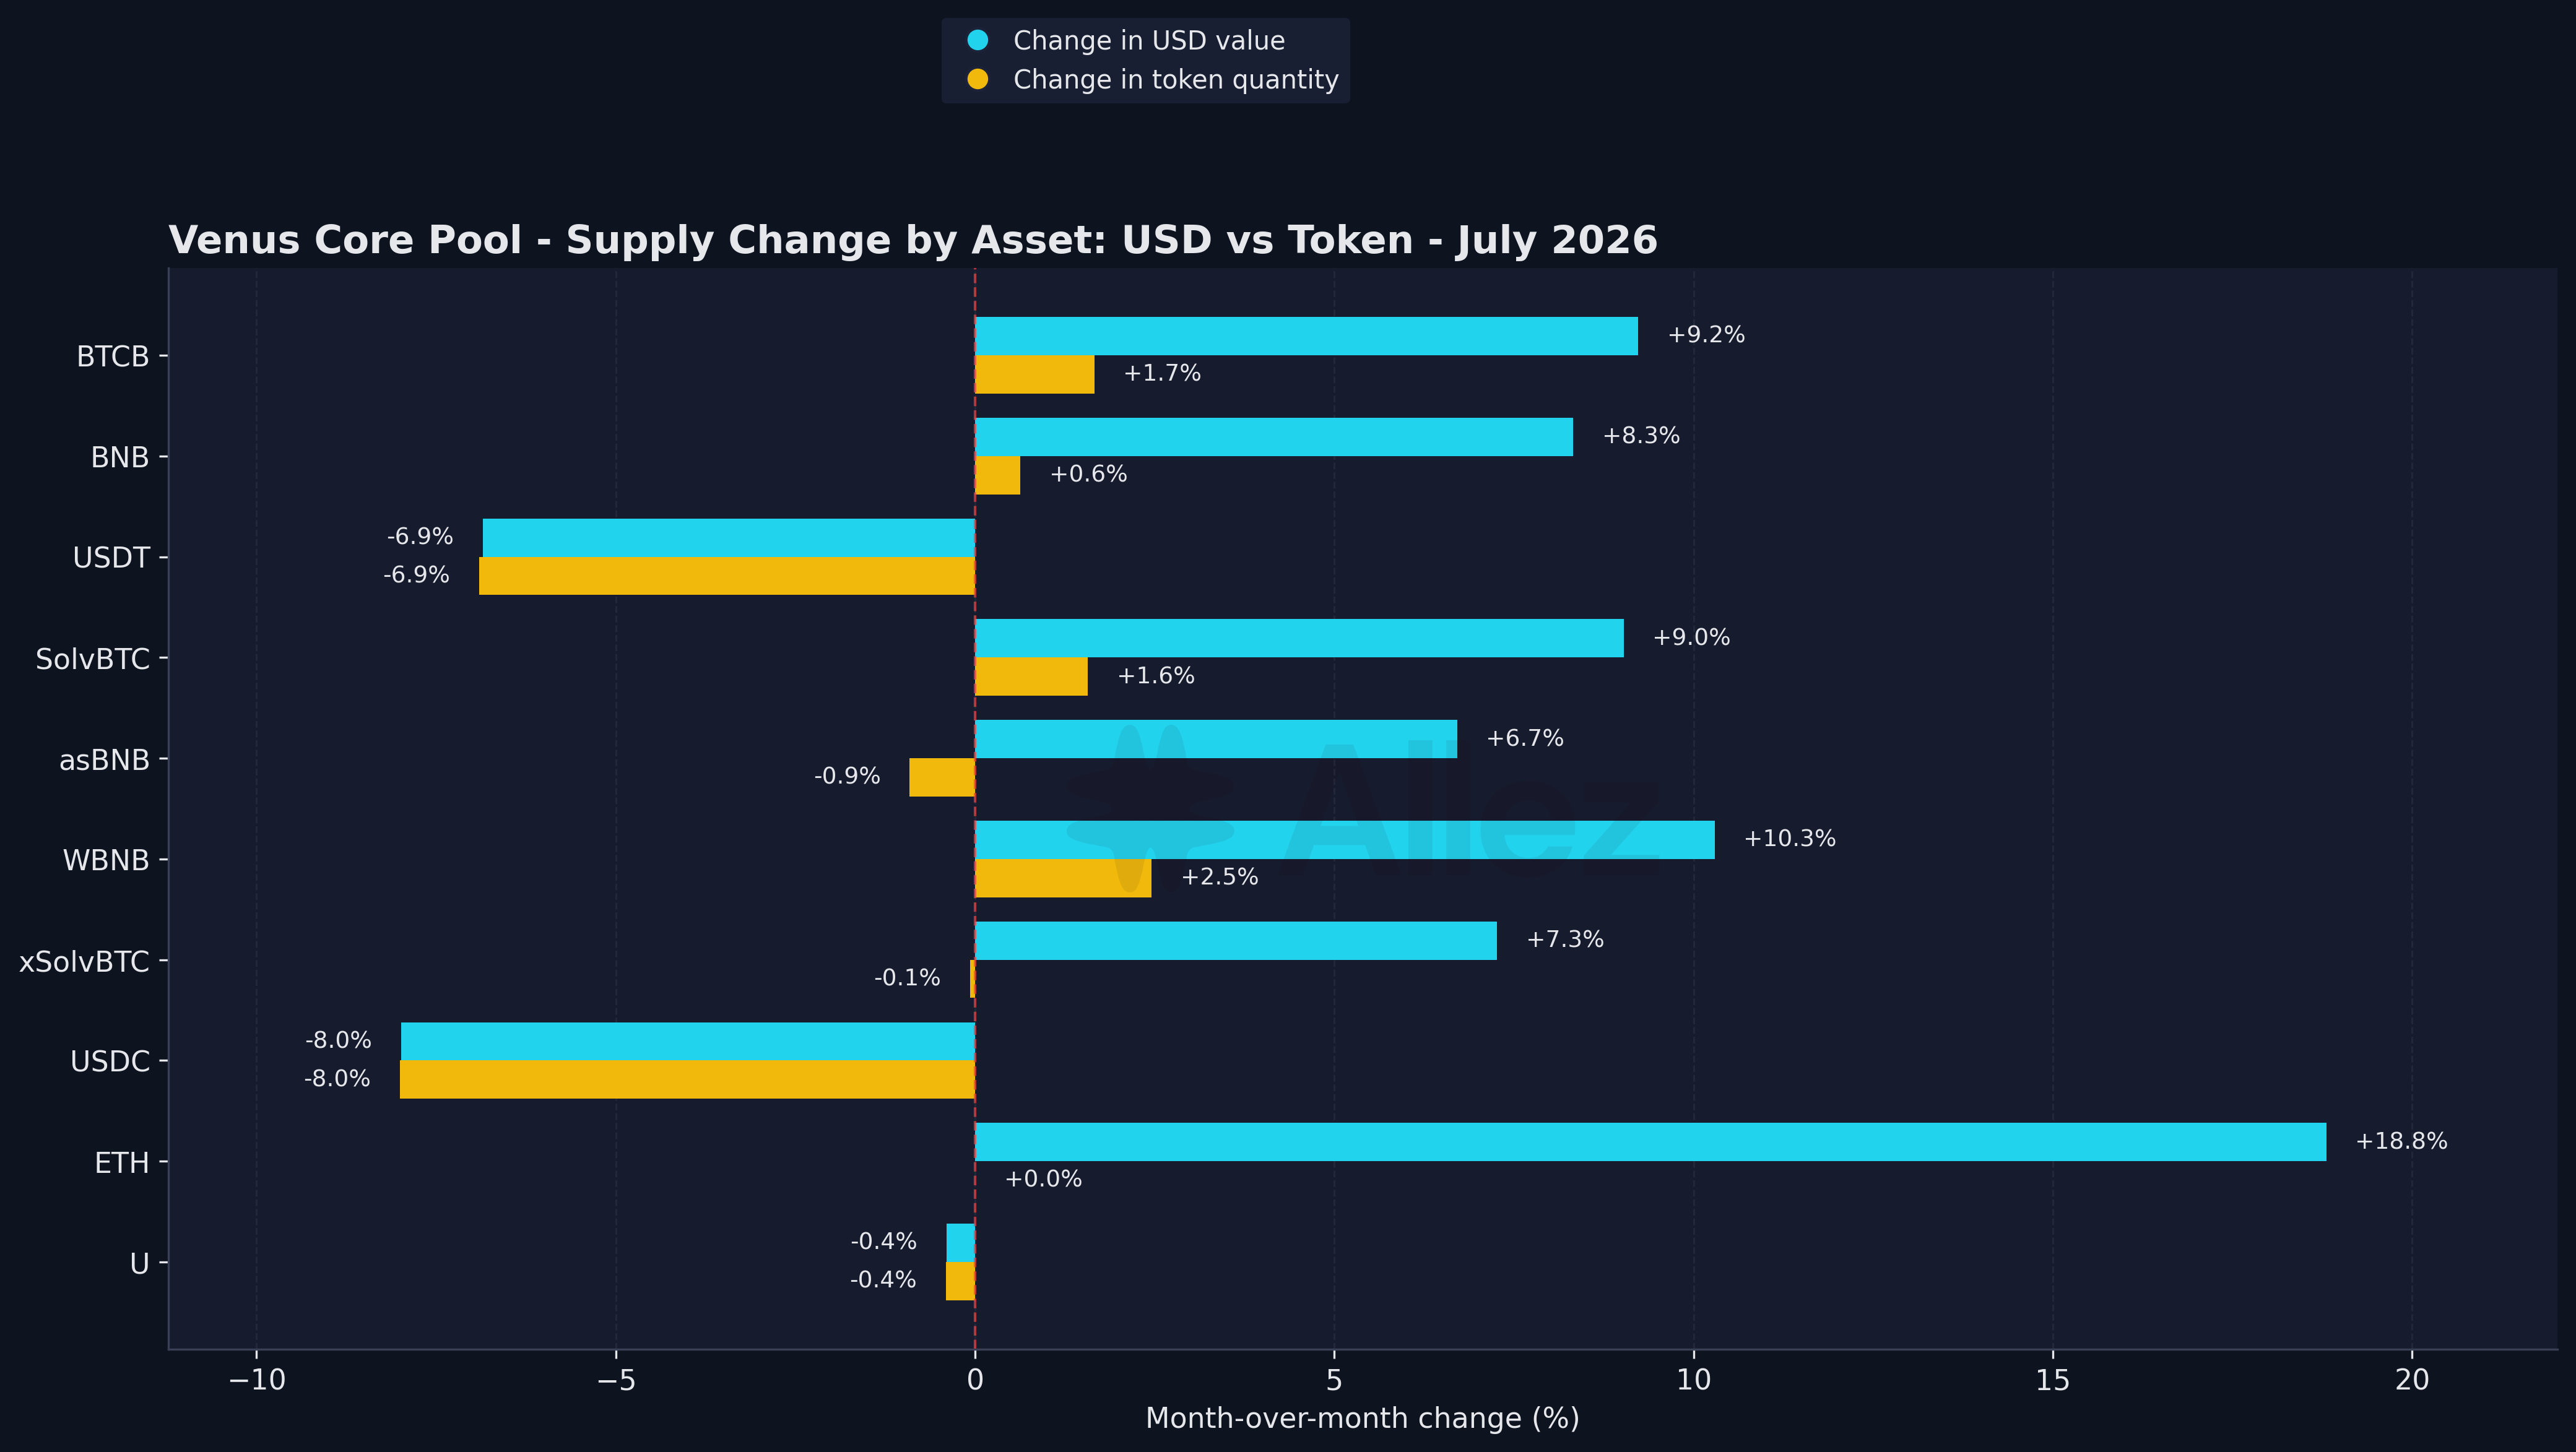
Supply Change by Asset
Splitting each asset’s monthly change into price and token quantity shows the same split at the asset level: the majors gain in dollars but hold flat in tokens.
3. Risk & Liquidations
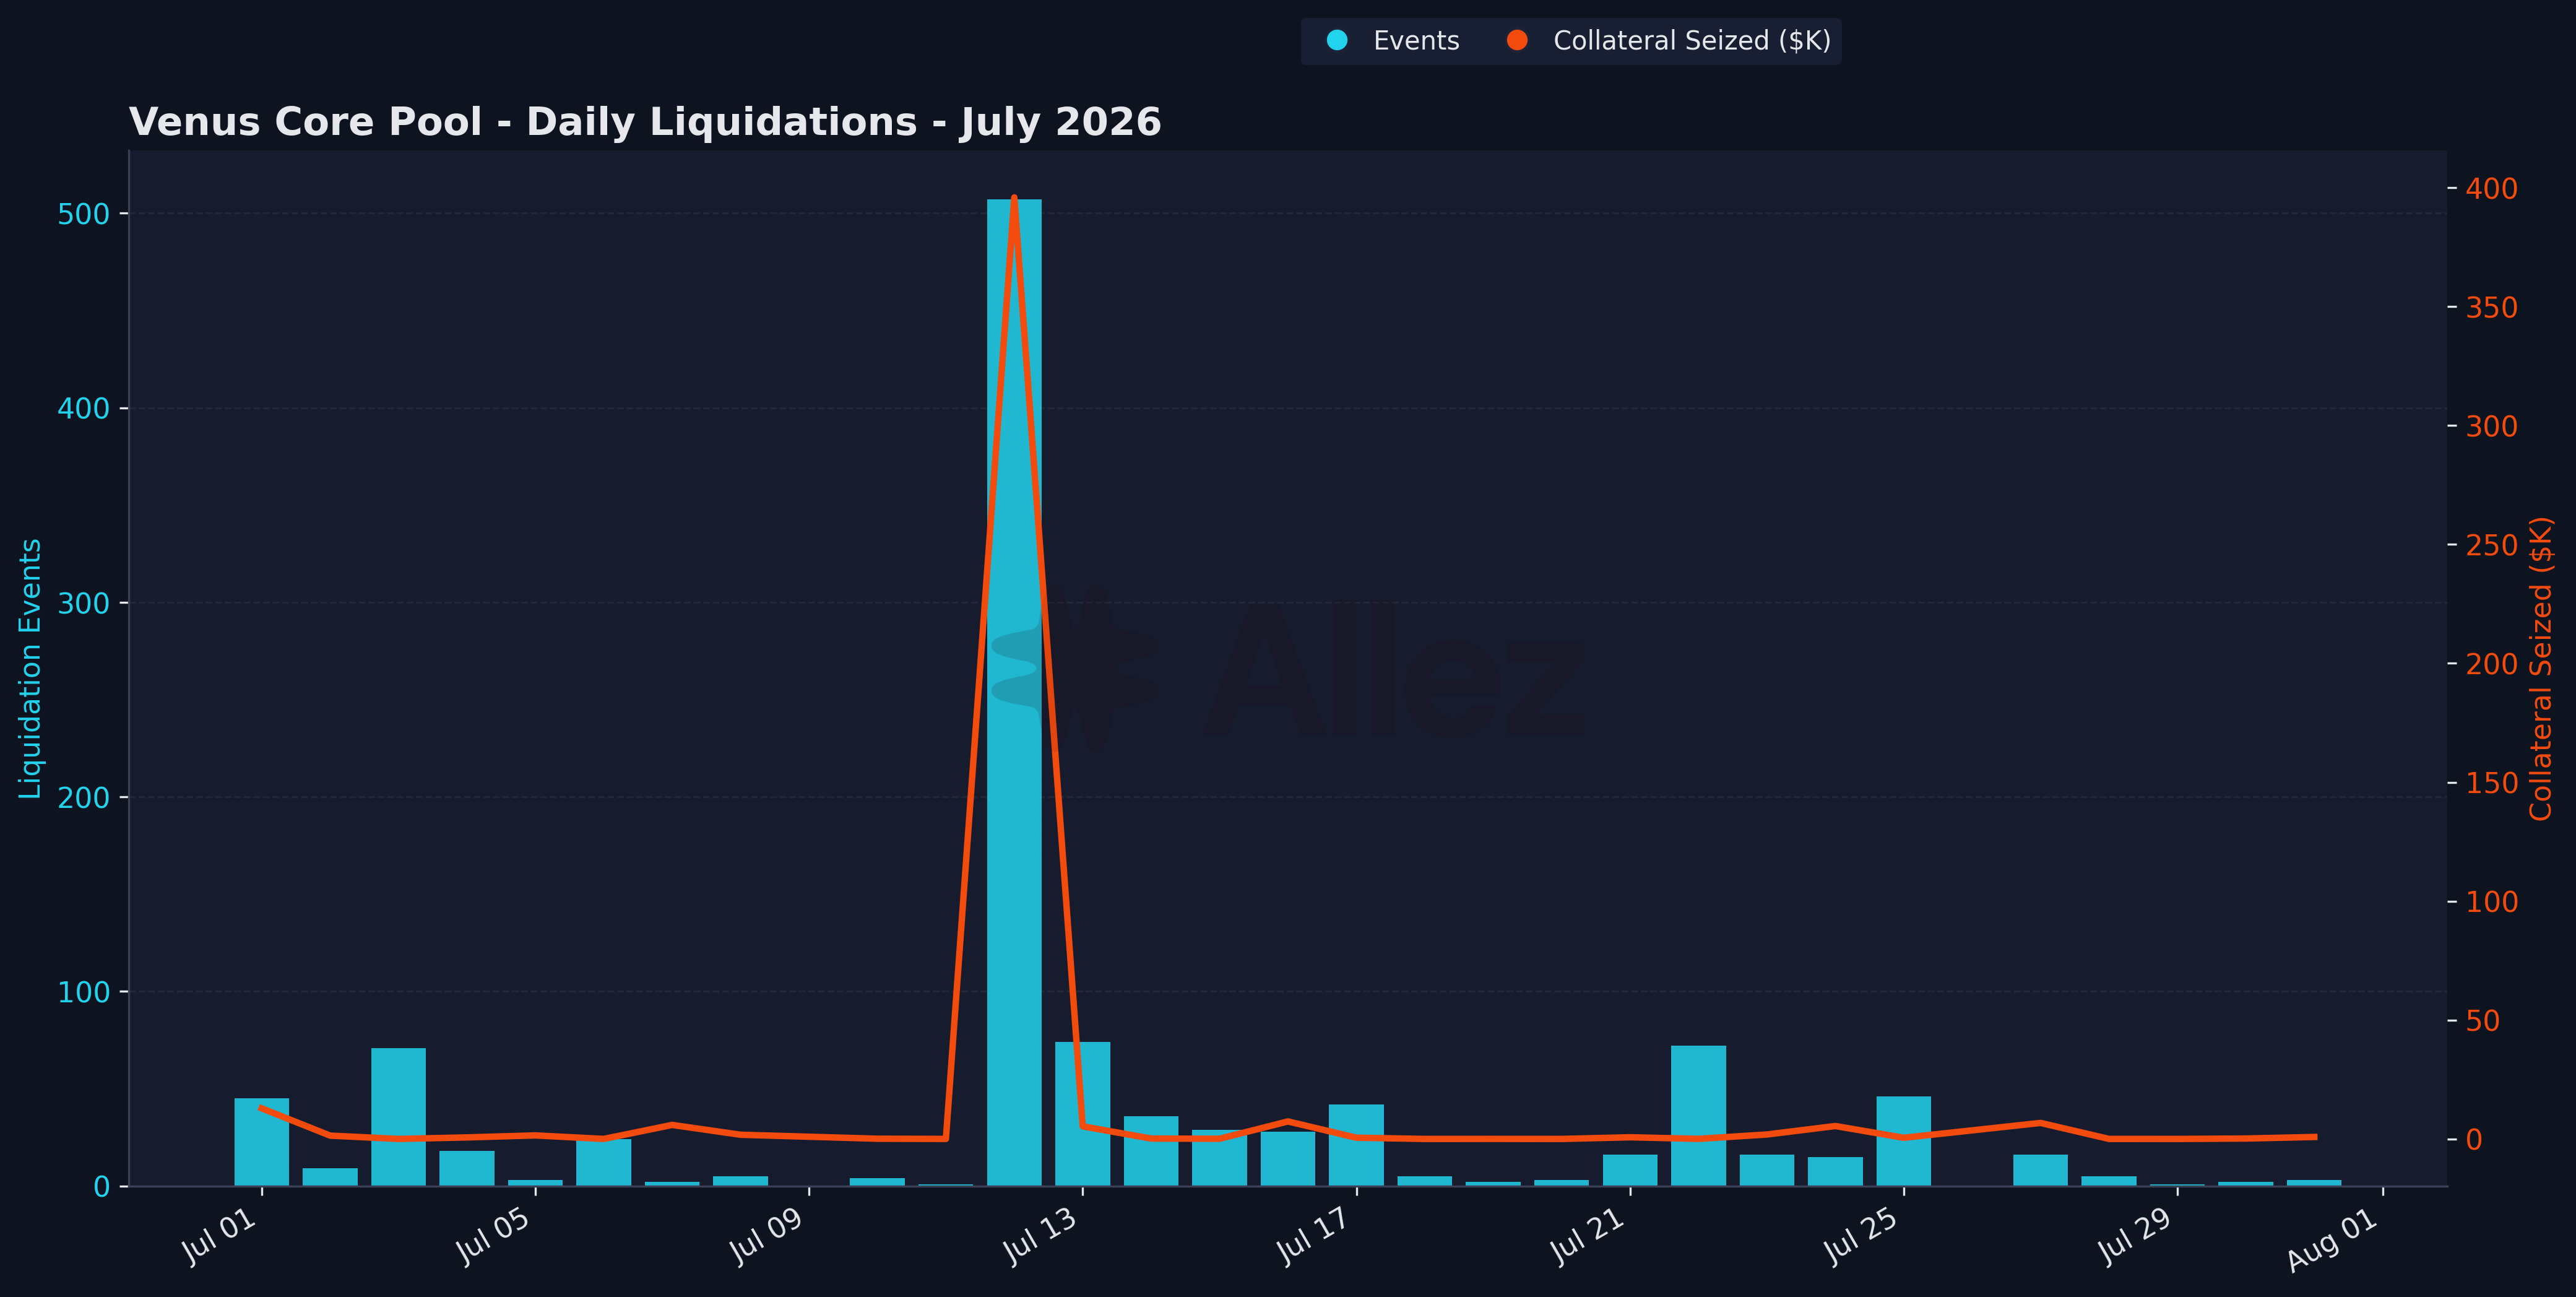
Daily Liquidations
Liquidation summary:
| Metric | July Total | July (ex-July 12) |
|---|---|---|
| Total events | 1,100 | 593 |
| Collateral seized | $449,967 | $54,012 |
| Debt repaid | $408,357 | n/a |
| Peak day | July 12 (507 events, $395,955) | July 1 (45 events, $12,889) |
July was a calm month for liquidations, with only ~$54k of liquidations occurring outside of the asset off-boarding (VIP-642) which carried the remainder.
Health factor distribution (July 31, 2026):
| Tier | HF Range | Debt | Share | Accounts |
|---|---|---|---|---|
| Critical | 1.0 - 1.1 | $44.4M | 11.7% | 938 |
| Warning | 1.1 - 1.25 | $83.6M | 22.0% | 1,772 |
| Elevated | 1.25 - 1.5 | $159.4M | 42.0% | 2,976 |
| Monitor | 1.5 - 2.0 | $55.7M | 14.7% | 2,643 |
| Safe | > 2.0 | $36.4M | 9.6% | 15,009 |
Total borrower debt of $379.6M remains healthy with about 11.7% ($44.4M) within 10% of its liquidation threshold. Of this debt, $40.9M sits in correlated collateral-debt pairs, leaving only $3.5M of genuinely directional debt exposed to price movements. Health factors are computed against each account’s effective liquidation threshold, including the higher thresholds that apply inside Venus e-mode pools.
Stablecoin debt by collateral:
| Collateral | Stablecoin Debt | Jun Debt | MoM | Within 10% of Liquidation |
|---|---|---|---|---|
| BTCB | $68.1M | $65.1M | +4.6% | $3.2M |
| SolvBTC | $33.0M | $38.4M | -14.1% | ~$0 |
| BNB | $24.7M | $28.1M | -12.1% | $0.5M |
| ETH | $8.0M | $7.4M | +8.1% | $0.1M |
| USDT | $7.5M | $7.9M | -5.1% | $5.3M |
Stablecoin borrowing is backed mostly by BTC and BNB collateral, and very little sits close to liquidation. Only $3.2M of the $68.1M BTCB-backed stablecoin debt is within 10% of its threshold.
Forward stress test:
July was a calm month, so to size the downside we simulate every position under a shock to volatile collateral and debt (stablecoins held at $1) and recompute health against each account’s effective liquidation threshold, including the higher thresholds that apply inside Venus e-mode pools.
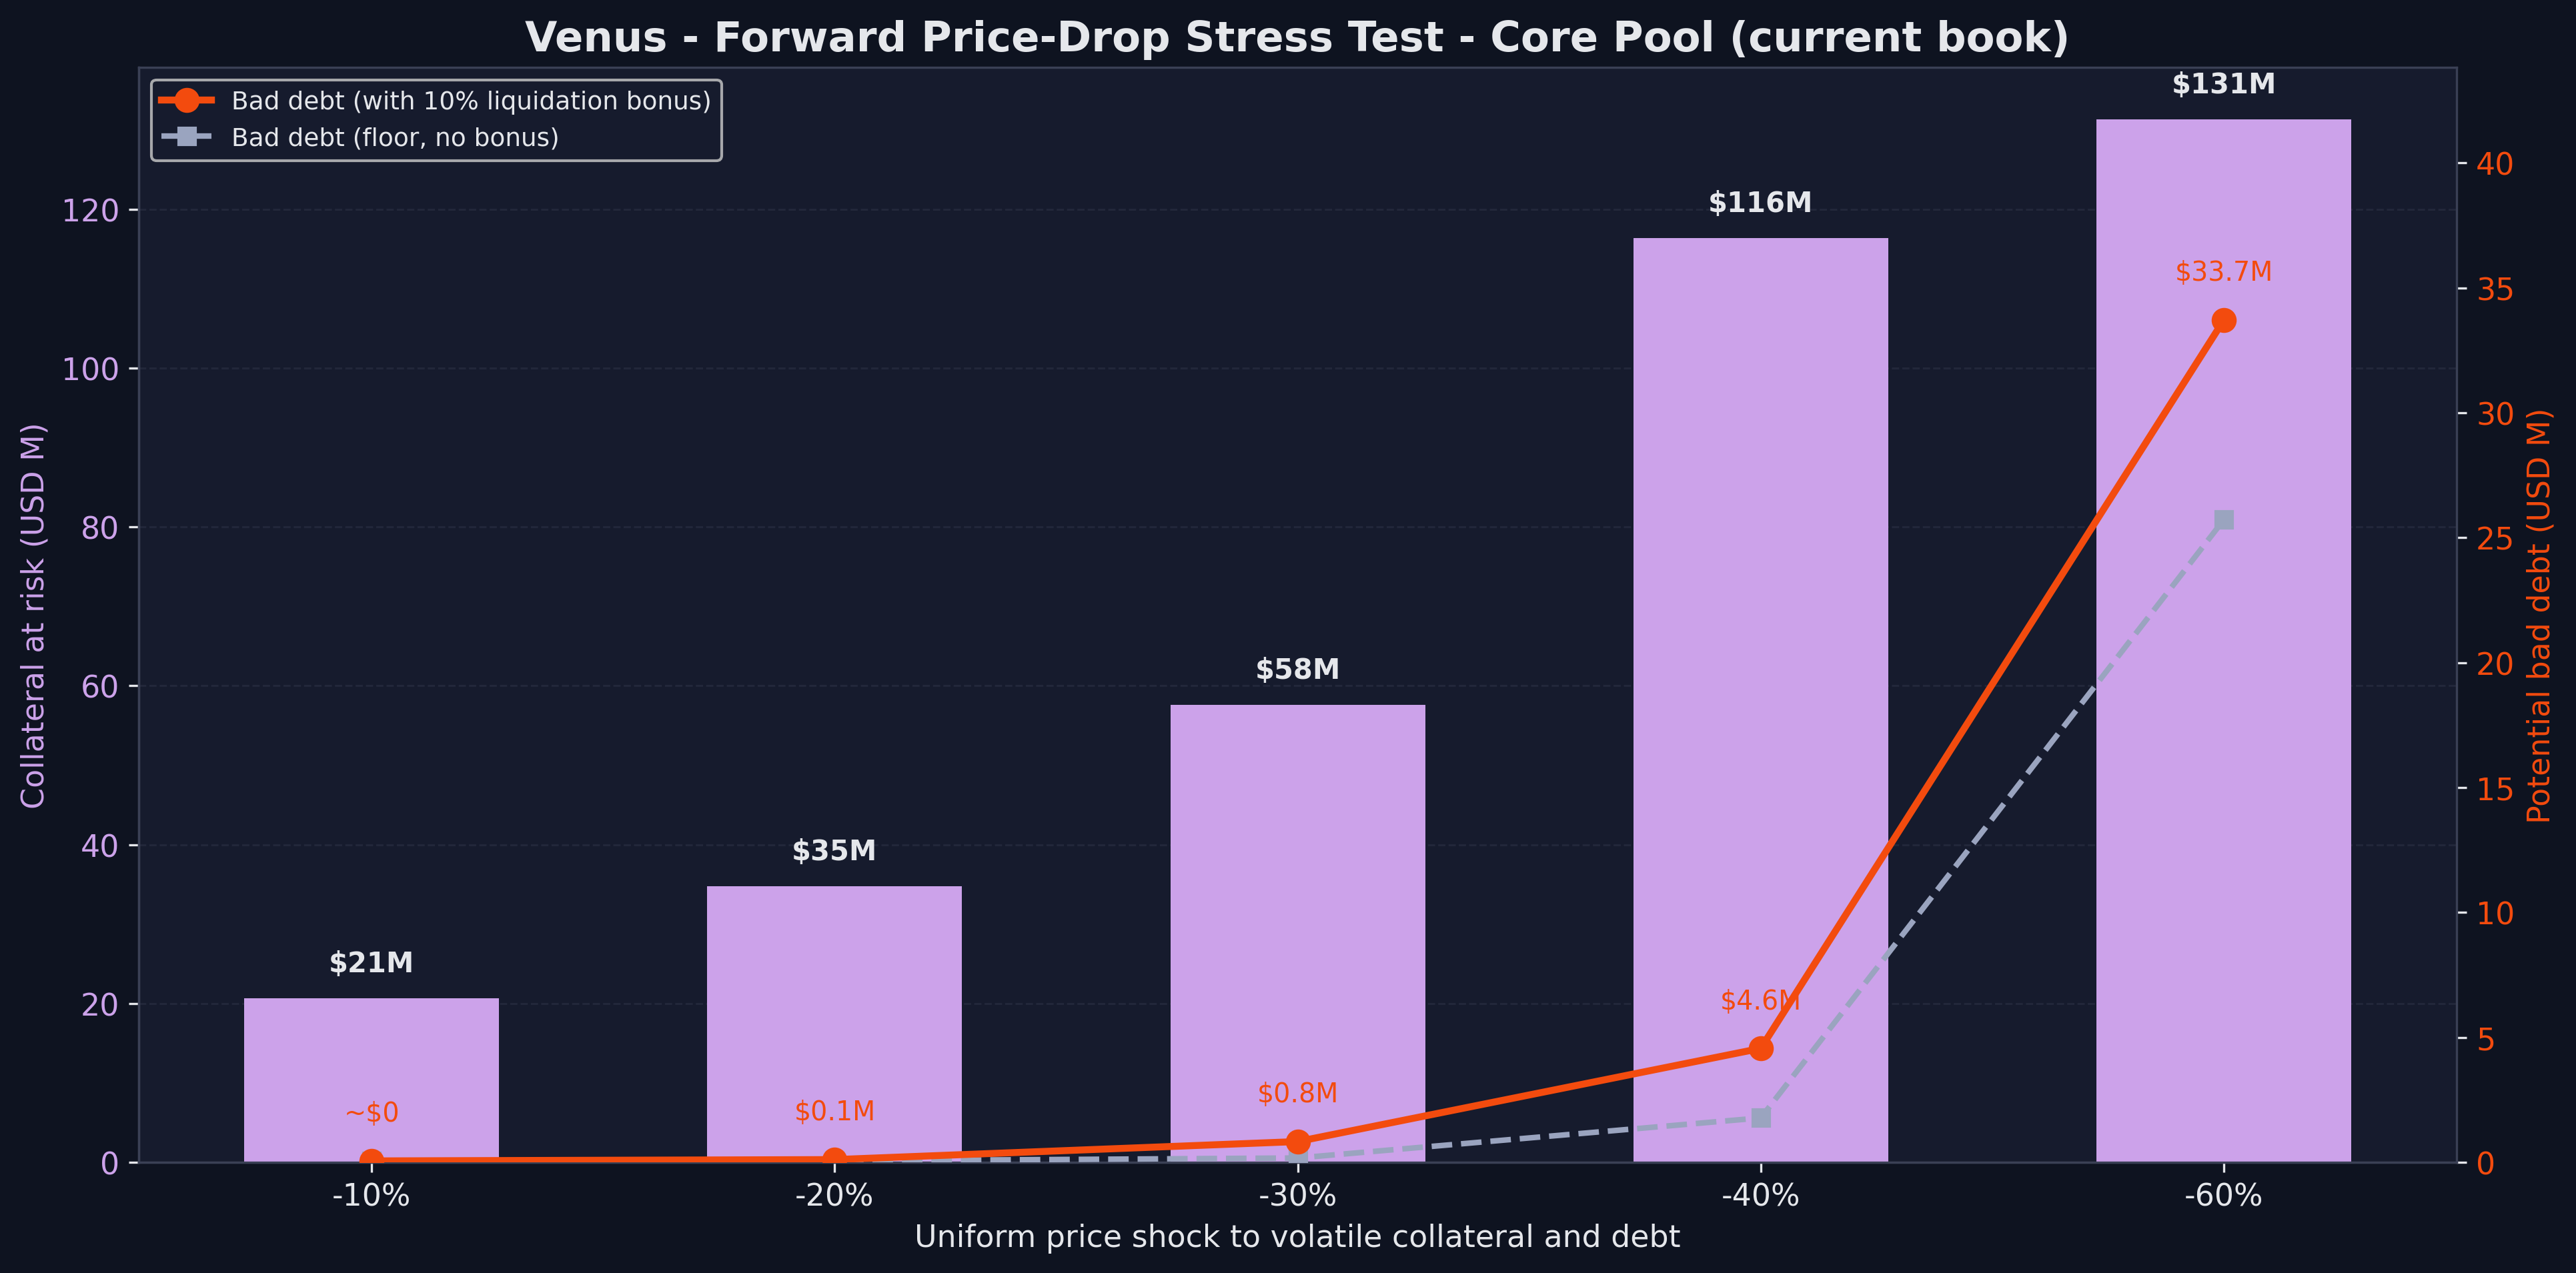
Forward Price-Drop Stress Test
| Further price shock | Accounts liquidated | Collateral at risk | MoM | Bad debt (+10% bonus) |
|---|---|---|---|---|
| Current book | 5,333 | $0.2M | n/m | ~$0 |
| -10% | 5,572 | $5.5M | -45.1% | ~$0 |
| -20% | 6,309 | $21.3M | -41.9% | $0.1M |
| -30% | 7,084 | $45.7M | -45.6% | $0.8M |
| -40% | 7,774 | $106.1M | -9.6% | $4.6M |
| -60% | 9,200 | $124.4M | -1.9% | $33.7M |
Venus’s exposure to market risk was materially reduced in July through both user positioning and the formal offboarding of several high-risk collaterals. At the June 30 snapshot, the book had more collateral at risk under every shock scenario except the near-current one. Collateral at risk under the 20% and 30% declines is 42% and 46% lower than at the end of June.
Potential bad debt at the 60% shock floor has fallen to $33.7M from $41.5M.
Methodology: A uniform shock is applied simultaneously to all non-stablecoin collateral and debt, representing a correlated market-wide decline. Positions are repriced using each month-end book snapshot, making the two periods directly comparable. An account is classified as liquidatable when the value of its collateral, multiplied by its liquidation threshold, falls below its debt. The bad-debt estimate is calculated net of the 10% liquidation bonus paid to liquidators.
This is a point-in-time analysis of the Core Pool book rather than a path-dependent liquidation cascade. It does not account for liquidator capacity or market slippage. By construction, the shock leaves correlated e-mode loops broadly neutral; their primary risk comes instead from a depeg or basis move between the two legs, which is separate from the directional market shock modeled here.
Top Borrowers and Borrower concentration:
| Borrower | Total Debt | MoM | Primary Asset |
|---|---|---|---|
| 0x3e8…90c | $45.1M | +7.6% | BNB |
| 0xc48…2a8 | $24.8M | -10.1% | BTCB |
| 0x5c1…e77 | $24.7M | +25.2% | BNB |
| 0x961…bf1 | $17.4M | +7.7% | BTCB |
The four largest borrowers hold roughly $112M of debt combined, about 29% of the protocol total (up from about $105M and 28.6% in June), all in the deepest markets (BNB and BTCB). The single largest is a $45M BNB borrow, about 12% of protocol debt. Deep on-chain liquidity should absorb an orderly liquidation. At this size, though, the health of a few wallets drives a meaningful share of protocol-level liquidation risk and warrants continued monitoring.
4. Collateral Structure
Top collateral/borrow pairs:
| Collateral | Borrowed | Debt | Jun Debt | MoM | Users |
|---|---|---|---|---|---|
| BTCB | USDT | $50.9M | $48.1M | +5.8% | 2,178 |
| SolvBTC | BTCB | $34.8M | $34.9M | -0.3% | 21 |
| asBNB | BNB | $31.7M | $28.8M | +10.1% | 34 |
| xSolvBTC | BTCB | $28.6M | $29.0M | -1.4% | 12 |
| SolvBTC | USDT | $28.3M | $33.2M | -14.8% | 38 |
| BTCB | BTCB | $28.0M | $26.7M | +4.9% | 613 |
| BTCB | BNB | $27.0M | $24.8M | +8.9% | 1,872 |
The pairs fall into two groups. The largest broad retail position is a leverage trade, BTCB collateral borrowing USDT ($50.9M across 2,178 users) and BTCB borrowing BNB ($27.0M across 1,872 users), holding BTC and borrowing stables or majors.
Meanwhile, there is also sizable correlated pairs held by primarily large users, SolvBTC and xSolvBTC borrowing BTCB ($34.8M and $28.6M across just 21 and 12 users) and asBNB borrowing BNB ($31.7M across 34 users). These fit yield or leverage loops on staked-asset baskets, and align with both the low headline utilization of the LST markets.
5. Utilization & Collateral Configuration
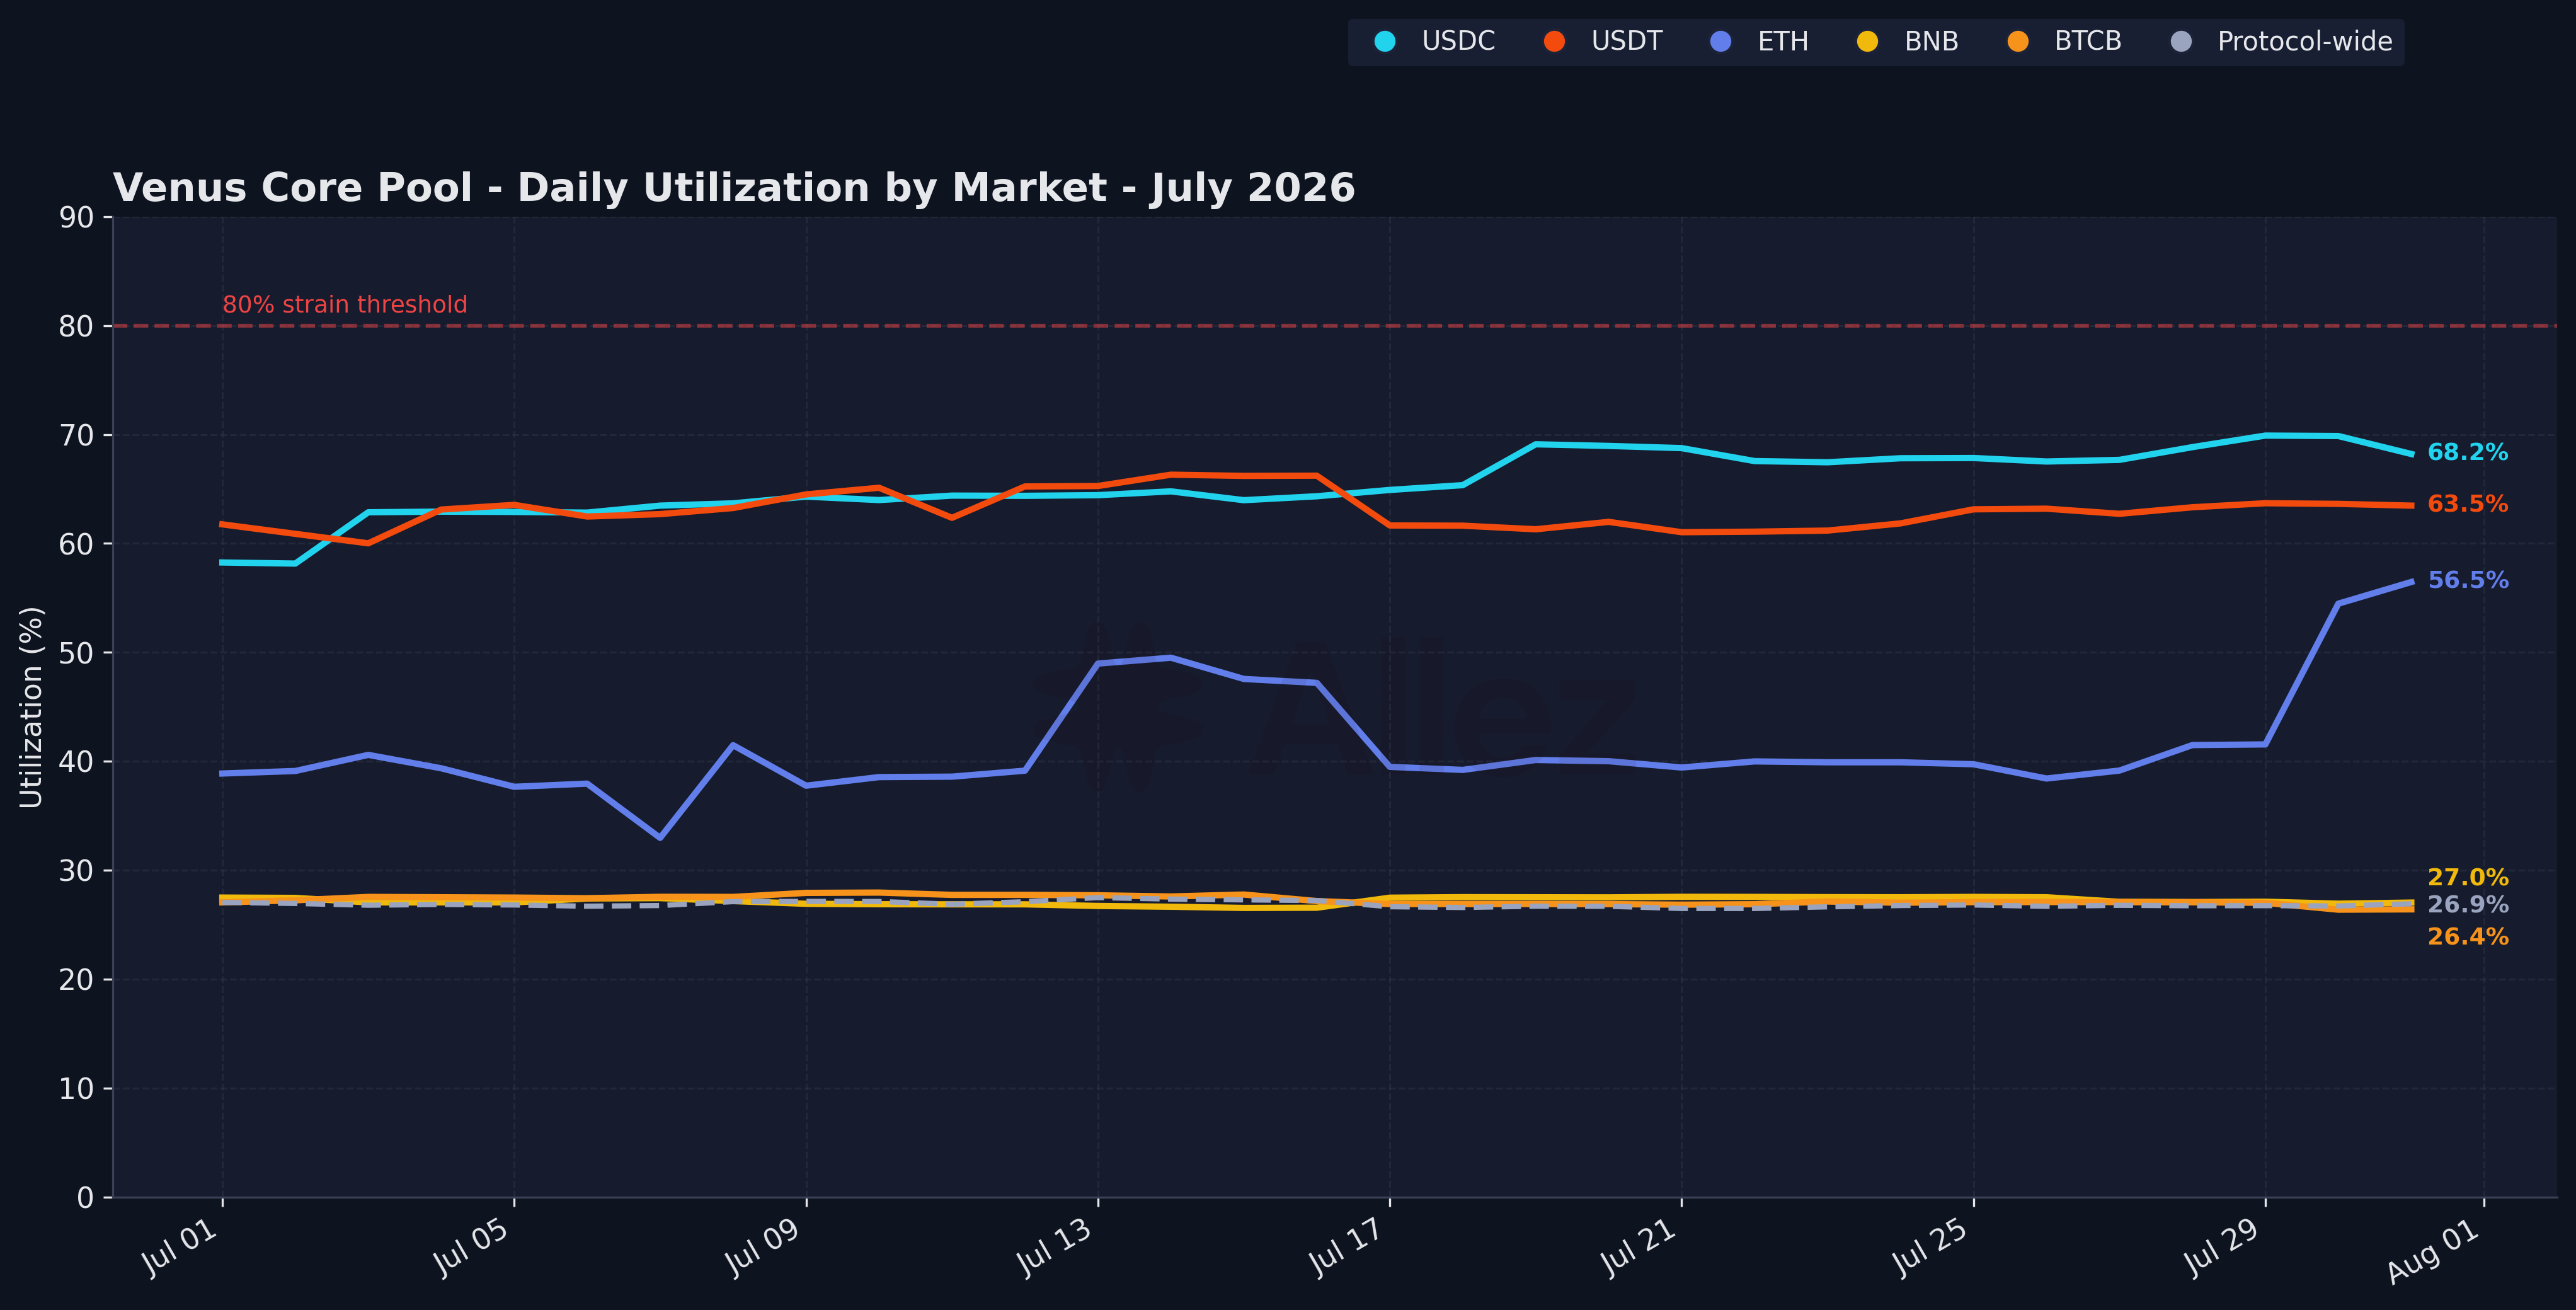
Utilization by Market
Utilization was stable across July and no market approached strain. Protocol-wide utilization held near 27% all month and closed at 26.9%. The most-used markets are the stablecoin borrow markets: USDC drifted up from about 58% to 68.2% and USDT ranged between 60% and 66% before closing at 63.5%. ETH sat in the high-30s to high-40s for most of the month, then climbed into month-end to close at 56.5%, still within its normal operating range.
6. Conclusions & Forward Look
Venus Core Pool had a quiet, healthy July. Liquidations fell sharply versus June ($450K seized against $4.24M) and the health-factor distribution stayed balanced, with only $3.5M of directional debt within 10% of liquidation. Supply grew 5.9% to $1.41B, largely on price, with BNB, BTC and ETH all rising while token balances for the majors stayed roughly flat. The one behavioural change was a $17M drop in stablecoin supply (USDT and USDC).
The structural picture is unchanged. BTC-backed assets remain the largest category (40.7%), while the large collateral-only SolvBTC, asBNB and xSolvBTC markets concentrate a meaningful share of debt in a few large positions tied to BTC and BNB prices.
Things to watch in August:
- Borrower and SolvBTC concentration. The top four borrowers hold roughly $112M (29% of protocol debt) and the SolvBTC/xSolvBTC markets ($208M) back the largest correlated loops. Monitor these wallets’ health factors and the depth available to liquidate them.
- Stablecoin outflows. July’s $17M reduction in USDT/USDC supply, against 63 to 68% utilization. A continued drawdown would tighten stablecoin borrow liquidity.
- E-mode basis risk. $40.9M of the near-liquidation debt sits in correlated pairs, asBNB against BNB and SolvBTC or xSolvBTC against BTCB, which hold their health because both legs reprice together. Venus grants these pairs liquidation thresholds of 0.83 to 0.92, so the buffer is thin to a depeg or redemption-rate move between a wrapper and its underlying. That, rather than a directional selloff, is the trigger to watch.
Core Pool enters August with low absolute leverage in the correlated positions, which limits systemic impact. The principal sensitivity remains BTC and BNB prices, given the concentrated collateral base.
Appendix: Asset Category Classification
| Category | Assets | Supply | Debt |
|---|---|---|---|
| BTC | BTCB, SolvBTC, xSolvBTC | $573.9M | $96.7M |
| BNB | BNB, WBNB, asBNB, slisBNB, PT-clisBNB | $467.8M | $100.9M |
| Stablecoins | USDT, USDC, U, USDe, sUSDe, lisUSD, FDUSD, DAI, TUSD, USD1, BUSD | $264.4M | $159.8M |
| ETH | ETH, wBETH, BETH | $54.9M | $20.9M |
| Altcoins | Cake, XRP, DOGE, ADA, DOT, FIL, LINK, UNI, AAVE, LTC, BCH, TRX, MATIC, THE, TWT, XVS, SOL | $50.5M | $1.6M |
| RWA | NVDAB, TSLAB, SPCXB, SKHYB (bStocks), XAUM (gold) | $0.2M | $0.0M |
Correlated positions hold collateral and debt in the same price category (for example SolvBTC against BTCB, or asBNB against BNB) and carry low directional risk. Uncorrelated positions span categories (for example BTCB against USDT) and carry true directional exposure.
Scope: Venus Core Pool on BNB Chain only.
This report represents independent risk analysis by Allez Labs for the Venus community.