Recommendations From Gauntlet
Summary
-
SXP:
- Decrease CF to 0 from 0.125
-
TRX:
- Raise CF to 0.525 from 0.50
-
XVS:
- Raise CF to 0.60 from 0.55
- Raise Supply Cap to 1,500,000 from 1,000,000
- We will provide separate recommendations for IR curves that will help fully deprecate SXP and TRXOLD.
Rationale
-
SXP:
- The previous two largest suppliers of SXP (addresses ending
34cfb4f1and068e9790) both reduced their SXP supply to zero. The largest SXP supplier on Venus supplies $18.6k of SXP and has a borrow usage of ~23%, and among all the remaining SXP suppliers that have a positive borrow balance, their borrow balances total about $5.8k. As such, lowering SXP’s collateral factor to zero immediately would not result in significant liquidations. - We will follow up with IR changes to SXP to completely deprecate SXP from Venus.
- The previous two largest suppliers of SXP (addresses ending
-
TRX:
- To encourage continued usage of TRX, we recommend raising the collateral factor to 0.525. We assess the risk of price manipulation with respect to collateral factor, borrow cap, and supply cap recommendations. Increasing the collateral factor from 0.50 to 0.525 continues to incentivize utilize TRX, without introducing additional meaningful risk of a price manipulation attack.
- We will follow up with IR changes to TRXOLD to completely deprecate TRXOLD from Venus.
-
XVS:
- Given XVS’s price seems to have stabilized after the spike on April 9, 2023, we recommend raising XVS’s CF back to 0.60 from 0.55.
- Further, given the high usage of XVS we recommend raising XVS’s supply cap from 1,000,000 to 1,500,000. This new supply cap represents a relatively small proportion of XVS’s circulating supply on BNB chain (~30m), so liquidity concentration is not an overly concerning issue.
General Update
Below we provide a broader update on Venus protocol’s risk metrics.
Value At Risk
The capital potentially at risk due to insolvencies when markets are under duress (i.e. liquidation cascade, stablecoin deviation from par). VaR captures insolvency risk for two high level categories: Broad Market Downturn, and Broken Correlation (for stablecoins and Liquid Staking Tokens). It is the expected insolvencies in a ‘worst-case’ crypto market downturn, based on historical data. For more details see here.
Liquidations At Risk
The capital potentially at risk due to liquidations when markets are under duress (i.e. liquidation cascade, stablecoin deviation from par). LaR captures liquidation risk for two high level categories: Broad Market Downturn, and Broken Correlation (for stablecoins and Liquid Staking Tokens). It is the expected liquidations in a ‘worst-case’ crypto market downturn, based on historical data. We note that while liquidations can affect borrower UX, healthy liquidations are a critical part of a capitally efficient protocol For more details see here.
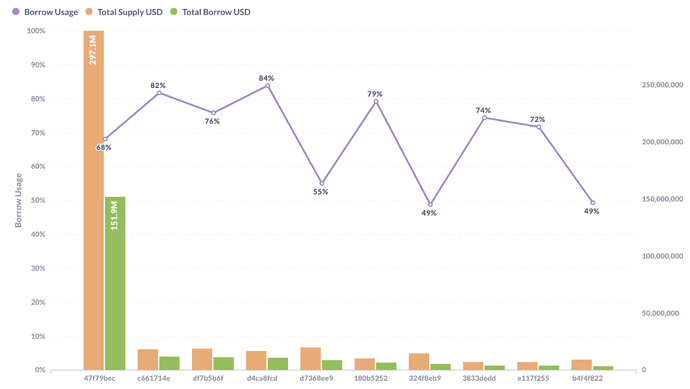
Borrow Usage
A measure of capital efficiency, it is the total available borrows based on collateral supplied to the protocol, calculated as supplies multiplied by the collateral factors (liquidation threshold) of each asset. Updated daily.
1. Methodology
Gauntlet’s parameter updates seek to maintain the overall risk tolerance of the protocol while making risk trade-offs between specific assets.
Gauntlet’s parameter recommendations are driven by an optimization function that balances 3 core metrics: insolvencies, liquidations, and borrow usage. Parameter recommendations seek to optimize for this objective function. Our agent-based simulations use a wide array of varied input data that changes daily (including but not limited to asset volatility, asset correlation, asset collateral usage, DEX / CEX liquidity, trading volume, the expected market impact of trades, and liquidator behavior). Gauntlet’s simulations tease out complex relationships between these inputs that cannot be expressed as heuristics. As such, the input metrics we show below can help explain why some of the param recs have been made but should not be taken as the only reason for the recommendation. The individual collateral pages on the Venus Risk Dashboard cover other vital statistics and outputs from our simulations that can help with understanding interesting inputs and results related to our simulations.
For more details, please see Gauntlet’s Parameter Recommendation Methodology and Gauntlet’s Model Methodology.
2. Risk Dashboard
The community should use Gauntlet’s Venus Risk Dashboard to understand better any updated parameter suggestions and general market risk in Venus. Value at Risk represents the 95th percentile insolvency value that occurs from simulations we run over a range of volatilities to approximate a tail event. Liquidations at Risk represents the 95th percentile liquidation volume that occurs from simulations we run over a range of volatilities to approximate a tail event. We would note that our methodology on borrow/supply caps is currently driven by risk modeling that is independent and additive to our risk simulations shown on the Dashboard.
3. Top Borrowers
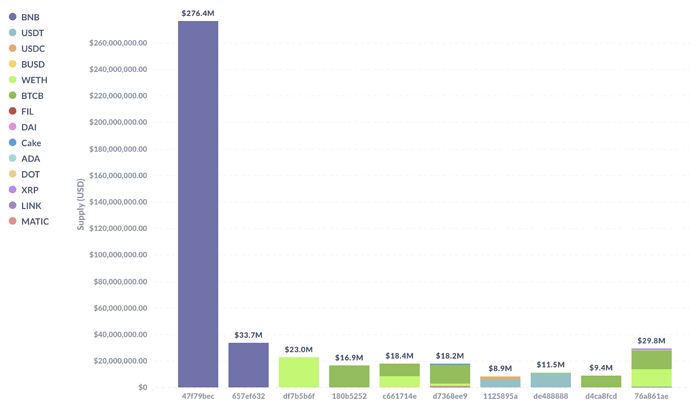
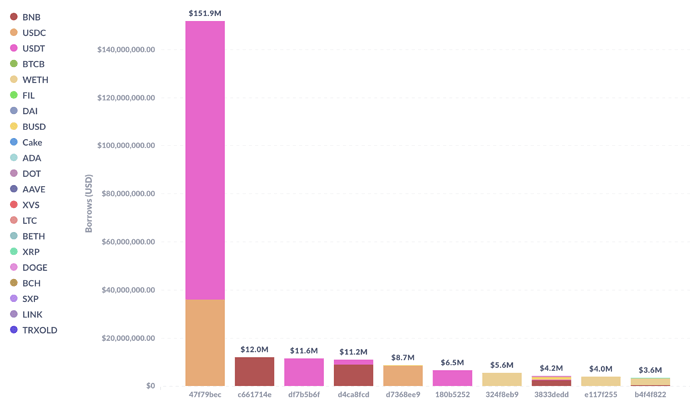
The below figures show trends in key market statistics regarding borrows and utilization that we will continue to monitor:
Top 10 Borrowers’ Aggregate Positions & Borrow Usages
Top 10 Borrowers’ Entire Supply
Top 10 Borrowers’ Entire Borrows
4. Liquidations
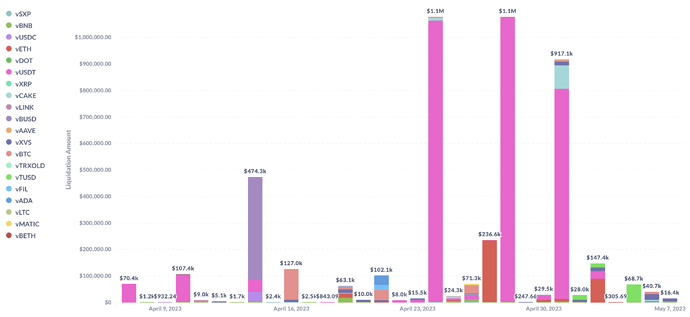
As Gauntlet tracks the state of the market and protocol, the charts below show some of the behavior we have been monitoring to ensure minimal market risk.
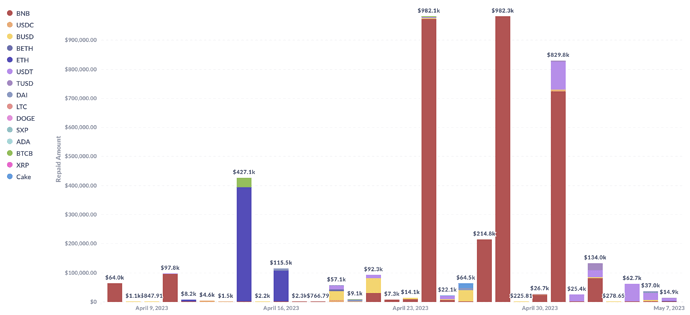
- April 10: A single user liquidation of $104.2k occurred on April 10. This user posted USDT as collateral to borrow WBNB and was liquidated as a result of a 3% increase in the price of WBNB on April 10.
- April 14: Venus saw a total of $474.3k in liquidation volume on April 14. The majority of this total is comprised of three individual user liquidations that borrowed ETH and were liquidated as a result of its 11% price increase on April 14. The three users were liquidated for $47.4k (supplied USDT), $231.7k (supplied BUSD), and $145.1k (supplied BUSD) respectively, totaling $424.5k of the total $474.3k liquidation volume for that day. One other liquidation of $36.1k occurred on April 14 for a user that borrowed BTCB and supplied USDC and was liquidated due to BTCB’s 14% price increase that day.
- April 16: Venus saw a total of $127k in liquidation volume on April 16, mainly comprised of two user liquidations of $64.2k and $52.7k. Both users borrowed ETH and supplied BTC, and were similarly liquidated as a result of ETH’s additional 3% price increase between April 14 and April 16.
- April 24: Liquidations totaling $1m of supplied USDT (with repaid borrows in BNB) were driven by a 3.8% rise BNB’s price in the days leading to April 24.
- April 27-28: Venus saw a total of $1.3m in liquidation volume between April 27 and April 28, comprised mainly of a large individual $1m liquidation on April 28 of a user borrowing WBNB and supplying USDT. Two other large user liquidations of note ($233k and $31k) occurred on these dates as well, also for users borrowing WBNB. The $233k liquidation supplied ETH, and the $31k liquidation supplied USDT. These liquidations can be attributed to WBNB’s 6% price decrease between April 27-28.
- May 1: Liquidated supply totaled $917k comprising of a $791.9k user liquidation of supplied USDT (repaid borrow BNB) and a $87.7k user liquidation of supplied cake (repaid borrow USDT). The former liquidation occurred as a result of BNB’s price rising 4.5% between April 30 and May 1, and the latter liquidation as a result of CAKE’s price declining by 7% on May 1.
We will continue to monitor user and protocol positions and make recommendations as needed. The charts below show the liquidations and repaid borrows of accounts liquidated in the past month.
Liquidation Amounts
Repaid Borrows
Next Steps:
- These recommendations will be put up for a VIP vote
By approving this proposal, you agree that any services provided by Gauntlet shall be governed by the terms of service available at gauntlet.network/tos.
