Hi Venus Community, Gauntlet has updated our recommendations, please see below:
TLDR:
- Gauntlet’s recommendation remains to reduce the CF of BNB to 75%, and we have updated our recommendations for borrow and supply caps in the table below.
Collateral Factor Recommendations
- BNB: Lower CF from 80% to 75%.
- To clarify, Gauntlet did a fresh analysis of the protocol and this adjustment is still being recommended.
Methodology
Our methodology remains the same:
This set of parameter updates seeks to maintain the overall risk tolerance of the protocol while making risk trade-offs between specific assets.
Gauntlet’s parameter recommendations are driven by an optimization function that balances 3 core metrics: insolvencies, liquidations, and borrow usage. Parameter recommendations seek to optimize for this objective function. Our agent-based simulations use a wide array of varied input data that changes on a daily basis (including but not limited to asset volatility, asset correlation, asset collateral usage, DEX / CEX liquidity, trading volume, expected market impact of trades, and liquidator behavior). Existing insolvencies are excluded from our simulations and VaR and LaR numbers, since we can only mitigate risk of future insolvencies. Gauntlet’s simulations tease out complex relationships between these inputs that cannot be simply expressed as heuristics. As such, the input metrics we show below can help understand why some of the param recs have been made but should not be taken as the only reason for recommendation. The individual collateral pages on the Gauntlet’s Venus Risk Dashboard cover other key statistics and outputs from our simulations that can help with understanding interesting inputs and results related to our simulations.
For more details, please see Gauntlet’s Parameter Recommendation Methodology 1 and Gauntlet’s Model Methodology 1.
Borrow / Supply Cap Recommendations
In light of the recent abnormal liquidations and activity across many lending protocols, Gauntlet recommends conservative borrow and supply caps on all assets, particularly on those who have low liquidity and/or supply on BSC, in order to significantly lower the potential for price manipulation. Over time, as the Venus lending market grows for many of these assets, we will continue to monitor these parameters and recommend adjustments as needed. We are amending our proposed supply and borrow caps for six assets (TRX, SXP, DOT, DAI, AAVE, and XRP) pulled to the top of the following table. We recommend proceeding with the remaining recommendations as previously presented.
| Token | Current supply caps | Current Borrow Cap | Recommended Supply Cap | Recommended Borrow Cap |
|---|---|---|---|---|
| TRX | - | - | 81,207,000 | 18,853,000 |
| SXP | 25,000,000 | - | 55,052,000 | 8,100,000 |
| DOT | 33,000,000 | - | 2,209,000 | 925,000 |
| DAI | - | - | 13,910,000 | 7,041,000 |
| AAVE | 422,000 | - | 30,000 | 10,000 |
| XRP | 1,000,000,000 | - | 35,938,000 | 4,248,000 |
| ———— | ————- | ———- | ———- | ———- |
| USDT | - | - | 736,300,000 | 245,500,000 |
| XVS | 25,000,000 | 0 | 1,311,000 | 0 |
| USDC | - | - | 258,000,000 | 124,700,000 |
| TUSD | - | - | 21,130,000 | 11,810,000 |
| MATIC | 262,000,000 | 6,718,000 | 1,470,000 | |
| LTC | 2,000,000 | 254,100 | 25,410 | |
| LINK | 15,000,000 | 2,388,000 | 238,800 | |
| FIL | - | - | 908,500 | 122,200 |
| ETH | - | - | 222,300 | 28,740 |
| DOGE | 4,000,000,000 | 157,700,000 | 23,240,000 | |
| CAKE | 7,000,000 | 2,500,000 | 7,000,000 | 3,749,000 |
| BUSD | - | - | 680,800,000 | 184,500,000 |
| BTCB | - | - | 22,770 | 3,531 |
| BNB | - | - | 2,672,000 | 2,008,000 |
| BETH | - | - | 21,890 | 16,450 |
| BCH | 500,000 | - | 26,820 | 4,331 |
| ADA | 1,000,000,000 | - | 37,510,000 | 14,430,000 |
Risk Off Liquidations:
Whenever we lower collateral factors, there’s a chance that some users may immediately become liquidatable as a result. There are a number of accounts that lend and borrow stablecoins and keep their balances just slightly above the liquidation threshold.
Reducing the collateral factor of BNB by 5% would push 101 accounts from
just above the collateral factor to just below the collateral factor. The accounts have a total borrow value of $35k. The top account has a borrow balance of $28k. Most of the accounts are extremely small with recursive holdings.
Supporting Data
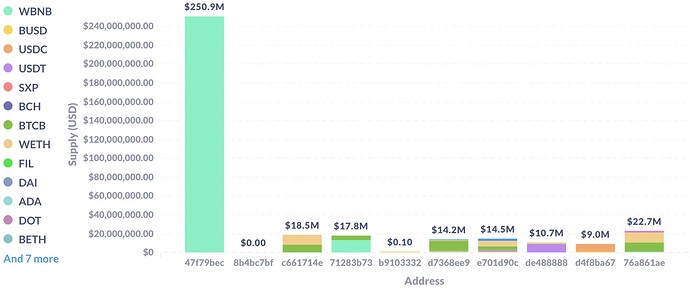
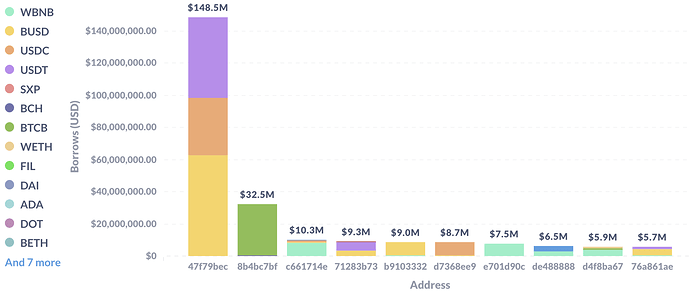
The figures above show the distribution in risk among the top borrowers - A large amount of BNB is concentrated in one borrower, which could lead to insolvencies. Because of this, we can observe why a large portion of the VaR is in BNB.
Risk Dashboard
The community should use Gauntlet’s Venus Risk Dashboard to better understand the updated parameter suggestions and general market risk in Venus.
Value at Risk represents the 95th percentile insolvency value that occurs from simulations we run over a range of volatilities to approximate a tail event.
Liquidations at Risk represents the 95th percentile liquidation volume that occurs from simulations we run over a range of volatilities to approximate a tail event.
Next Steps
- Gauntlet will be putting up a snapshot vote for the community to vote on the implementation of these recommendations

