Summary
IntoTheBlock (ITB) is requesting a grant to build a suite of risk management indicators and dashboard for Venus and its community.
- Dashboards that include indicators that allow monitoring of both protocol, pool-specific, and asset-specific economic risks
- API access and interactive documentation
- Raw data access via CSV download for all metrics at hourly resolution
- Documentation of each indicator with practical examples of how to use them in order to prevent risks (similar to our resources pages)
- Quarterly updates by ITB’s team to add support for new assets
The dashboard would be hosted and accessible within ITB’s platform in a new risk management section. The offered indicators and its raw data would be openly available for anyone without any additional costs or account needed, similarly to how our DeFi Insights are accessible now. These indicators will be easily accessible through our app by all current ITB analytics users, giving Venus’ protocol additional exposure to new potential users.
About IntoTheBlock
ITB was founded in 2019 and is currently the largest crypto market intelligence provider. We have support in our app for custom analytics for more than 9 blockchains, +1000 coins, +5000 NFT collections, and 10 DeFi protocols, as well as other traditional finance metrics. Our analytics are available for both retail users and institutions, integrating with partners such as Binance, CoinGecko, CoinMarketCap, Bitstamp, Deribit, Decrypt, Coindesk, and Tradingview, in addition to 300+ other companies.
IntoTheBlock has been deeply involved in the DeFi ecosystem over the past two years. Specifically, the recent work has been on building quantitative strategies for institutions based on DeFi protocols. Through our DeFi Quant Platform, we have helped over 20 of the largest crypto institutions deploy more than $1B in assets via sophisticated, non-custodial strategies aided by our risk management models. Risk monitoring and management are the cornerstone of the ITB DeFi Quant platform allowing institutions to interact with DeFi protocols while effectively managing economic risk.
ITB is committed to contributing to DeFi and we believe that through open risk management we can help improve the security and overall health of the space. The goal with this effort is to both help protocols transparently monitor economic risk in their platforms, while also providing tools that allow users to initiate their own autonomous research to provide further insights and strengthen the community. This process has started with approved proposals to other lending protocols such as Euler, Benqi, Moonwell and soon others that have not been announced yet.
Motivation
DeFi lending protocols are exposed to risks from hacks to economic attacks. While all protocols have an inherent risk from a hack, lending protocols have an increased exposure to economic attacks compared to other projects. Such attacks as have been seen recently in the loss of $100M+ from the Mango Markets protocol cannot be fully mitigated through code in a smart contract. Therefore, these risks need to be constantly monitored and evaluated by a protocol’s team and community.
In addition to the increased risk exposure that lending protocols face due to external economic risks, they also have second-hand exposure to the risk appetites of their users. Due to the core dynamics of lending markets and its interaction with the independent choices of external actors (e.g., users), lending protocols must remain vigilant towards how certain actors, such as whales, utilize their markets. Liquidations of large lenders or borrowers can have a cascading effect on other users, creating a situation where the protocol can be at risk of becoming insolvent. Not only are economic risks historically a larger attack vector, they can also be monitored and mitigated real-time due to the blockchain’s nature, which is why at ITB we have opted to focus on these risks.
These economic risks are a dominant concern for lending protocols. Fortunately, the transparency and real-time data availability of a blockchain makes it possible to develop metrics that track risk exposure from multiple angles. Indicators that monitor key metrics for the pools and assets on the protocol provide tools to both the team and community members to flag risks, increasing the resiliency of the protocol as a whole.
ITB has gained expertise and experience safeguarding hundreds of millions into DeFi through risk management models. With ITB’s risk explorer initiative, one of the priorities is to democratize the access to appropriate risk metrics for the DeFi ecosystem. Following this path ITB decided to make these risk metrics and models accessible via an API and analytics dashboards. The purpose of this proposal is to make these risk models available to the Venus’ community and users to autonomously monitor and evaluate risks as they arise.
Specification & Implementation
ITB is requesting $95,000 to enable near real-time economic risk monitoring and analytics for the Venus protocol. Specifically, the grant will cover the following deliverables:
- Risk API: REST API enabling access to all the proposed indicators.
- Risk dashboard: Web interface that includes visualizations of the risk indicators.
- Documentation and use cases: Complete documentation of all risk indicators included in the release.
The risk indicators (found in the Appendix) will be for all the assets currently supported on the Venus protocol, with an example visualization of the data (not yet live, only example data given) from ITB’s UX team (in Appendix). Depending on the data used, indicators will be tailored to give an overarching viewpoint of the protocol, asset specific information, or both.
How Our Offer Differs From Other Risk Solutions
There are certain key points where we think that our offer differs greatly from other approved grants that cover risk monitoring analytics:
- Proven metrics: Indicators developed by our battle tested engineering team that are trusted by some of the largest institutional clients in the sector.
- Real time risk monitoring: Indicators are calculated on a near real time basis.
- Data accessibility: CSV export and API access available to everyone.
- Interactive historical charts: Fully historical data with selectable time frames.
- Improved resolution: Hourly data instead of daily.
- Innovative indicators: Concentration risk metrics and whale indicators not available elsewhere.
- Complementary value to existing services: Other protocols, such as Euler and Benqi, that have requested risk analysis from other companies have still commissioned our product as it increases risk monitoring capacities and is more accessible to users.
- Price efficient: Our product provides value to the protocol at substantially lower prices than many of our competitors. Additionally, compared to free data solutions, our indicators offer a longer history, interactive features, and data-tailored visualizations for users to pinpoint specific data they want to analyze.
ITB’s proposed risk dashboard will bring value to the Venus protocol through indicators that provide immediate actionable insights. The data, accessible via download or API, gives the community flexible access to the indicators. They can access directly via the risk dashboard that ITB will host, or they can export the data to use in any programming environment. Openly accessible data provides further possibilities of community-based analysis and user-developed metrics to help them monitor their portfolio.
Proposal Milestones & Payments
ITB is requesting payments to be structured by milestones along with an initial set up fee in the following way:
- Upfront payment - $20k
- Indicators 1-10 (dashboard + API) - $20k
- Indicators 11-20 (dashboard + API) - $20k
- Documentation covering Venus’s risk dynamics - $20k
- Quarterly upgrades and maintenance, such as adding new tokens, modifying metrics based on feedback and to cover infrastructure costs - $15k
The breakdown of the costs proposed in this budget can be found in the Venus Proposal Costs Transparency section of the Appendix.
These indicators are subject to modification based on feedback from the community and Venus’ team. ITB is committed to maintain and expand the capabilities of the Venus risk monitoring solution that address changes to the protocol or market conditions.
Appendix
Proposed Risk Indicators
| Risk Parameter | By Pool/Protocol | Sub-Category | Description | Visualization | Why is it Useful? |
|---|---|---|---|---|---|
| Whale Supply Concentration | Both | Supply | Historical concentration of deposits by address | Stacked line | Risk of liquidity not being able to be withdrawn if a whale withdraws their liquidity |
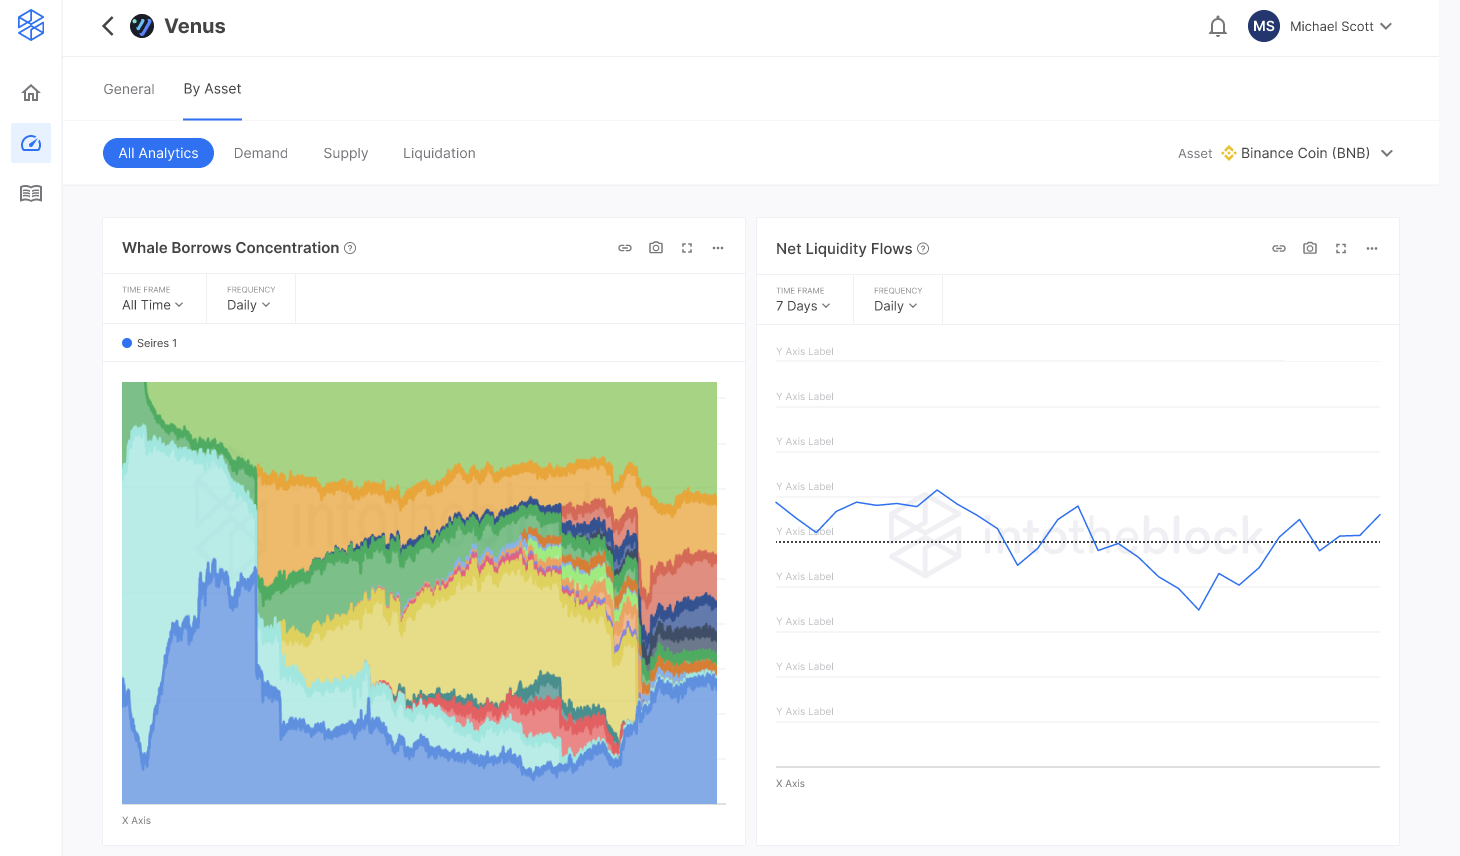
| Whale Borrows Concentration | Both | Demand | Historical concentration of borrowing activity by address | Stacked line | Risk of concentrated exposure from large borrowers |
| Net Liquidity Flows | Both | Supply | Historical Inflows, outflows and netflows of liquidity into the pool (potentially being able to select top depositors) | Bar + line | Liquidity exiting the pool consistently can be a leading indicator of uncertainty due to exogenous factors or better yield opportunities |
| Collateral Asset Market Cap | Protocol | Supply | Market capitalization of assets accepted as collateral at Venus over time | Line (indicating each token series) | In most money markets, pools have shared liquidity, making the weakest link a potential vulnerability to the protocol as a whole. For instance, in the Venus liquidations incident, someone manipulated the price of XVS (smallest market cap asset) and borrowed so much that liquidators were not able cover the protocol when the price of XVS crashed shortly after |
| Whale Exit Evolution | Pool | Supply | Impact that the largest addresses exiting would cause on liquidity available to be withdrawn | Bar + Line | If large depositors withdraw their liquidity, the pool may reach a point where there is no cash available to withdraw at its worst, or sharply increase borrowing costs |
| Recursive Lending Share | Both | Supply | Percentage of liquidity provided that is made up from recursive lending | Stacked line | Provides a sense of how to expect liquidity to behave when rewards/yields change |
| Current Whales Credit History | Both | Demand | Tracking large depositors’ loans, repayments and liquidations | Table | If a whale has a track record of being liquidated, could be likely that they get liquidated again |
| Whale Liquidity | Both | Demand | Funds available in whale addresses | Line | An illiquid address could have a hard time at repaying the debt being liquidated |
| Health Factor Distribution | Both | Demand | Distribution of loans in the protocol grouped by their collateral ratio | Stacked line with buckets color-coded based on how close to liquidation (e.g. <1.05 HR = red, 2.0+ = green) | If most of the supply has a low health factor, the solvency of the protocol is at risk due to large liquidations |
| High Risk Loans | Both | Demand | Value of loans against volatile collateral within 5% of liquidation | Line and stacked line (showing % considered as high risk) | To understand exposure to high risk loans and anticipating future liquidations |
| Unique Liquidator Addresses | Both | Liquidations | Number of unique addresses that interact with the liquidation function in a given day or cumulative | Line (2 tabs for daily and cumulative) | It is healthy and efficient for a lending market to count with a high number of addresses that frequently liquidate undercollateralized positions |
| Blocks Elapsed to Complete Liquidations | Both | Liquidations | The number of blocks it takes for a liquidation opportunity to be filled, showing the USD amount and percentage of the arbitrage filled per block | Bar chart up to 100% | The faster liquidations are done, the less risk of insolvency. Blocks elapsed since a $10k liquidation opportunity arises |
| Open Liquidations | Both | Liquidations | Number of positions and corresponding volume pending to be liquidated | Line + bar | Could be a leading indicator of insolvency |
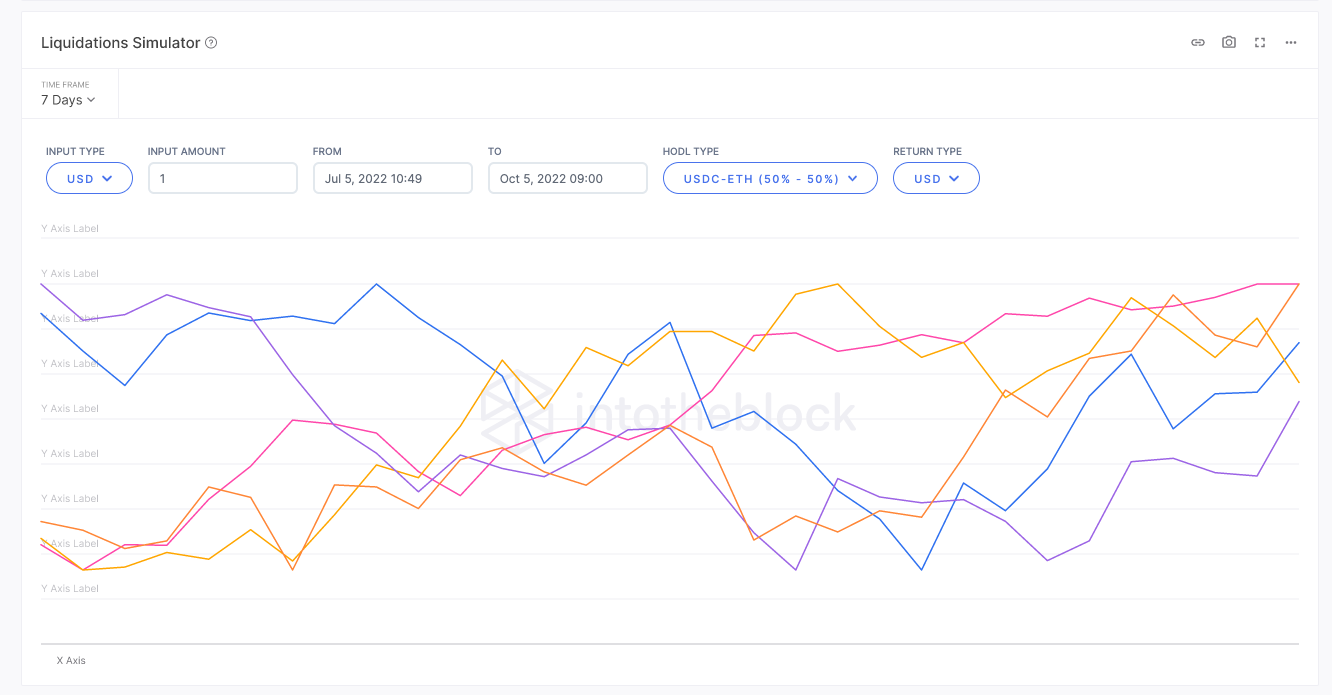
| Liquidations Simulator | Pool | Liquidations | Volume that would be liquidated given x change in prices | Line + custom selection | Provides insights to users on potential future risks in a volatile market |
| Liquidations Volume | Both | Liquidations | Total value liquidated historically, daily and by token | Line Graph, stacked bar | Provides a sense of value obtained by liquidators in order to protect the protocol from bad debt |
| Liquidators Leaderboard | Both | Liquidations | Leaderboard of top liquidators by the following criteria: Rewards ($) , # of Liquidations, % of Successful liquidations | Table | Gives an idea of most involved liquidators with the protocol, the dependencies on each and their overall performance |
| Liquidation Levels | By Asset | Liquidations | Liquidation price levels for assets | Stacked Bar | Understand critical price level for each asset where a majority of the liquidations could happen |
| Liquidator Estimated Profitability | Asset | Liquidations | Potential profit liquidators would realize by selling collaterals provided to back high risk loans, taking into consideration the liquidation bonus and returns after slippage on DEXs | Bar chart | If it is unprofitable to liquidate, then the protocol would end up with bad debt. This means lenders would lose their funds and the protocol would have to cover losses with their reserves and potentially become indebted |
| Secondary Pool Liquidity | Asset | Asset | Liquidity of the asset available in pools outside of the protocol | Line | If liquidity on the most liquid pools/exchanges drops the profitability of an arbitrageur could be minimized due to slippage and could reduce liquidations to a point of protocol insolvency. Illiquid assets in dexes are the most vulnerable to price manipulation attacks |
| Asset Solvency Gauge | Asset | Asset | Estimation of a pool’s risk of insolvency based on size relative to liquidity in DEXs, slippage, high risk loans and respective liquidation bonus | Gauge for real-time, stacked line to track historical values | Summarizes valuable data regarding how susceptible the protocol is to end with bad debt based on internal metrics and market conditions |
Risk Indicator Dashboard Mock-up
Link to Interactive Mock-up Dashboard
Screenshots from Dashboard

Venus Proposal Costs Transparency
The proposal for Venus’ risk monitoring interface will support the engineering and infrastructure costs associated with the solution. Specifically, ITB will rely on the following team and infrastructure components:
Engineering Resources
| Role | Responsibility | Approx Cost |
|---|---|---|
| Data Scientist | Modeling and backtesting the risk indicators for the Venus protocol. | $25,000.00 |
| Full Stack Engineer | Develop the API endpoints to enable programmable access to Venus’ risk indicators. | $25,000.00 |
| Data Engineer | Develop the data processing pipeline to collect, cleanup and persist datasets from the Venus protocols in order to be analyzed. | $35,000.00 |
| Total | $85,000.00 |
Infrastructure Resources
| Component | Description | Cost |
|---|---|---|
| Data Processing Pipeline | ETL pipeline based on Apache Airflow to orchestrate the collection of data from the Venus protocol APIs. | |
| Data Lake | The data collected from the data processing pipeline will be added to ITB’s data lake based on Google BigQuery. Currently, ITB’s data lake hosts over 150TB of data. | |
| Risk Data Models | The risk models will be developed using Keras and TensorFlow stacks. | |
| Risk Monitoring APIs | The API endpoints will be implemented as a combination of AWS Lambda and AWS API Gateway. | |
| Total | $10,000.00 |