Summary
- USDT (Core Pool) - Set supply and borrow cap to 400M and 300M, respectively
- WBETH (Core Pool) - Set supply cap to 40K
- DOT, AAVE, LTC, MATIC, BCH, LINK, ADA, XRP, TRX, DOGE, ETH, FIL - Reduce supply and borrow caps to better align with current utilization and liquidity -
Analysis
WBETH
The supply cap for WBETH on Venus Core Pool is currently at 100% utilization.
Utilizing our supply and borrow cap methodology, we recommend increasing the borrow cap to 40K WBETH.
Positions
The examination of wallet distributions indicates no substantial risk and we have not identified outsized positions actively affecting our recommendations.
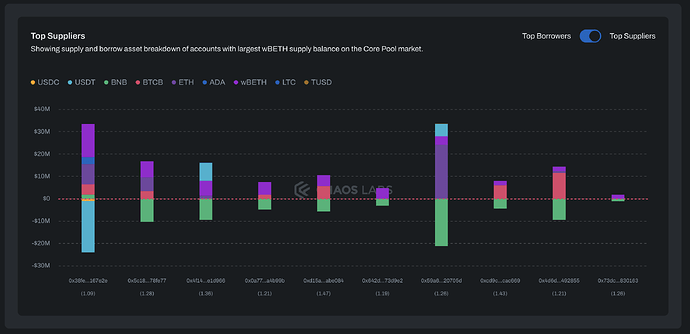
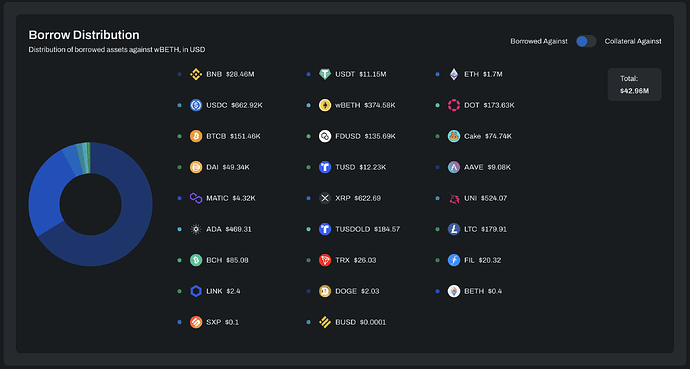
The total WBETH supplied as collateral on Venus is approx. 27K, amounting to ~$70.2M. The top 10 suppliers (detailed below) hold approximately 76% of the total WBETH supplies. They predominantly utilize their WBETH holdings as collateral to borrow USDT and BNB.
| Current Supply Cap | Recommended Supply Cap | Current Borrow Cap | Recommended Borrow Cap | |
|---|---|---|---|---|
| WBETH | 27,000 | 40,000 | 2,200 | 1,000 |
USDT
The borrow cap for USDT on Venus Core Pool is currently at 80% utilization.
Utilizing our supply and borrow cap methodology, we recommend increasing the borrow cap to 300M USDT. In addition, to better align the supply cap to current supply, we recommend setting the supply cap at 400M.
| Current Supply Cap | Recommended Supply Cap | Current Borrow Cap | Recommended Borrow Cap | |
|---|---|---|---|---|
| USDT | 736,300,000 | 400,000,000 | 245,500,000 | 300,000,000 |
Core Pool Assets (DOT, AAVE, LTC, MATIC, BCH, LINK, ADA, XRP, TRX, DOGE, ETH, FIL)
Chaos’ strategy in determining supply and borrow caps involves a delicate balance, ensuring ample room for growth while imposing a firm upper limit for enhanced protocol security against unforeseen user actions and risks. The caps are determined by analyzing user behavior, particularly supply and borrow patterns and liquidity conditions. This strategy enhances the protocol’s resilience against unexpected user or market exposures. More details on our supply cap methodology can be found here.
After reviewing Core Pool asset utilization, we recommend reducing caps to better match current usage and market conditions. This adjustment aims for approximately 50% utilization of the caps for selected assets. Our team continuously monitors cap utilization across all assets and pools. We will keep the community informed and provide further recommendations as needed, responding to shifts in demand and market trends.
Recommendations
| Asset | Current Supply Cap | Current Supply | Recommended Supply Cap | Current Borrow Cap | Current Borrow | Recommended Borrow Cap |
|---|---|---|---|---|---|---|
| DOT | 2,200,000 | 594,000 | 1,200,000 | 925,000 | 172,000 | 400,000 |
| AAVE | 30,000 | 10,500 | 20,000 | 10,000 | 1,200 | 2,000 |
| LTC | 254,100 | 62,000 | 120,000 | 25,400 | 5,100 | 10,000 |
| MATIC | 16,000,000 | 5,100,000 | 10,000,000 | 3,000,000 | 337,300 | 1,000,000 |
| BCH | 26,800 | 5,100 | 10,000 | 9,000 | 419 | 1,000 |
| LINK | 2,400,000 | 434,000 | 900,000 | 238,800 | 37,400 | 80,000 |
| ADA | 37,500,000 | 25,200,000 | No Change | 14,400,000 | 820,700 | 2,000,000 |
| XRP | 35,900,000 | 12,100,000 | 24,000,000 | 4,200,000 | 1,300,000 | 3,000,000 |
| TRX | 12,000,000 | 8,300,000 | No Change | 10,000,000 | 3,800,000 | 6,000,000 |
| DOGE | 157,700,000 | 47,700,000 | 80,000,000 | 23,200,000 | 2,700,000 | 4,500,000 |
| ETH | 222,300 | 67,300 | 100,000 | 40,000 | 29,000 | No Change |
| FIL | 908,500 | 480,000 | No Change | 180,000 | 19,400 | 90,000 |


