Overview
Yield-bearing tokens are key assets for maximizing the utilization of a money-market protocol. These assets not only have a robust user base but also, when listed on Venus, generate a base yield for holders, which is sourced from third-party protocols.
Venus currently holds many idle assets in its lending pool that could be borrowed by using yield-bearing tokens as collateral. Implementing a new strategy is expected to attract over $1 billion in TVL and more than $500 million in active loans.
1. Targets and Goals
The table below displays the target pools included in the growth strategy, along with their current idle liquidity, utilization rate, and end-goal loan amounts or ideal utilization rate.
| Target pools | Idle liquidity + utilization rate | goal loans and utilization rate |
|---|---|---|
| BTC | 712M / 6% utilization | 350M-600M / 50%-90% |
| BNB | 265M / 43% utilization | 350M-420M / 90%-95% |
| USDT | 152M / 57% utilization | 300M-330M / 85%-90% |
| USDC | 57M / 52% utilization | 100M-110M / 85%-90% |
| ETH | 59M / 53% utilization | 105M-110M / 90%-95% |
| FDUSD | 12M / 51% utilization | 22M-24M / 85%-90% |
The table highlights significant potential for Venus to increase its TVL and active loans. For every $1 of idle liquidity, it can be converted into $1.10 in TVL and $1 in active loans (details to be explained later).
2. Integrations + E-mode
To launch a successful E-mode, we must integrate several yield-bearing assets to ensure its use case, which will be crucial for maximizing protocol liquidity utilization. Each asset will have its base APY sourced from a third-party protocol. The table below lists the assets to be added and their current underlying APY.
| Asset | Underlying APY | Protocol | Source of yield | TVL | Already added on core pool? |
|---|---|---|---|---|---|
| asBNB | 16% + points | Asterdex | LST + Launchpools | 300M | Yes |
| SlisBNB | 17% | ListaDAO | LST + Launchpools | 555M | No |
| wstETH | 2.7% | Lido | LST | 22B | No |
| weETH | 3.4% + Points | EtherFi | LRT | 6.6B | No |
| WBETH | 2.55% | Binance | LST | 6.4B | Yes |
| sUSDe | 4%-8% | Ethena | Delta Neutral | 6B | Yes |
| asUSDf | 8%-11% | Asterdex | Delta Neutral | 300M | No |
| sUSDx | 5%-15%+ Points | StableLabs USDx | Delta Neutral | 700M | No |
| xSolvBTC | 2%-5%+Points | Solv Finance | Launchpools+LRT | 2B | Yes |
| SolvBTC.BNB | 2%-8% +Points | Solv Finance | Launchpools | 2B | No |
| SolvBTC | Points | Solv Finance | Token airdrop | 2B | Yes |
| LBTC | Points | Lombard Finance | Token airdrop | 1.8B | No |
| PT-sUSDe | 9% | Pendle | Delta Neutral | 4.9B | Yes |
| PT-USDe | 8.5% | Pendle | Token Airdrop | 4.9B | No |
| PT-asUSDf | 9% | Pendle | Delta Neutral | 4.9B | No |
| PT-asBNB | 9.4% | Pendle | Launchpools | 4.9B | No |
| PT-ClisBNB | 7.7% | Pendle | Launchpools | 4.9B | No |
| PT-xSolvBTC | 1.4% | Pendle | Launchpools | 4.9B | No |
| PT-SolvBTC.BNB | 2.7% | Pendle | Launchpools | 4.9B | No |
3.1 Strategy
As outlined in the integration and E-mode plans, we have included key assets critical for creating a competitive looping environment to attract yield farmers. Based on past experiences, Venus users are accustomed to looping assets for higher APY, as observed in previous deployments. However, we are now introducing a new looping model where the supply APY is sourced from third-party protocols, and low borrowing rates are derived from the deep liquidity within Venus’s core pool, rather than rewards emissions.
When examining competitors like AAVE, we observe that they set their interest rate (IR) curve parameters below typical market rates, yet maintain utilization rates between 80% and 90% for core assets. Whenever their kink point is reached, they attract significant liquidity from users not engaged in looping. Loopers then borrow this new liquidity, leading to consistent increases in TVL and revenue. We can adopt a similar strategy by adjusting the kink to 90% and driving utilization to a much higher level than our current rate, which should yield results comparable to those of competitors who have implemented this approach.
Furthermore, with the introduction of E-mode on Venus, users will be able to loop yield-bearing assets up to eight times, depending on the risk parameters set by our risk partner. For now, AAVE’s parameters provide a reliable benchmark for what we can anticipate. As a result, users should be able to more than quadruple their yield through looping, significantly boosting TVL and generating substantial revenue from loops for Venus.
3.2 Strategy table
The table below outlines the maximum upside of each strategy available to users, assuming each asset can be looped up to 7.7 times, as seen on competitors.
Formula: Maximum APY = (Collateral Asset APY × 7.7) − (Loan Asset APY × 6.7)
| Collateral asset | Collateral asset 30 days APY | Loan asset | Current loan asset APY on Venus | Maximum APY that can be reached |
|---|---|---|---|---|
| asBNB | 16% | BNB | 2% | 109.8% Instead of 16% |
| SlisBNB | 17% | BNB | 2% | 117.5% Instead of 17% |
| wstETH | 2.7% | ETH | 1.59% | 10.13% Instead of 2.7% |
| weETH | 4% | ETH | 1.59% | 20.14% Instead of 4% |
| WBETH | 2.55% | ETH | 1.59% | 8,982% Instead of 2.55% |
| sUSDe | 9% | USD | 5.3% | 33,79% Instead of 9% |
| asUSDf | 10% | USD | 5.3% | 41,49% Instead of 10% |
| sUSDx | 11% | USD | 5.3% | 49,19% Instead of 11% |
| xSolvBTC | 5% | BTC | 0.6% | 34.48% Instead of 5% |
| SolvBTC.BNB | 6% | BTC | 0.6% | 42,18% Instead of 6% |
| SolvBTC | 1% | BTC | 0.6% | 3.68% Instead of 1% |
| LBTC | 2% | BTC | 0.6% | 11,36 Instead of 2% |
| PT-sUSDe | 9% | USD | 5.3% | 33,79% Instead of 9% |
| PT-USDe | 8.5% | USD | 5.3% | 29.4% Instead of 8.5% |
| PT-asUSDf | 9% | USD | 5.3% | 33,79% Instead of 9% |
| PT-asBNB | 9.4% | BNB | 2% | 58.98% Instead of 9.4% |
| PT-ClisBNB | 7.7% | BNB | 2% | 45.89% Instead of 7.7% |
| PT-xSolvBTC | 1.4% | BTC | 0.6% | 6.76% Instead of 1.4% |
| PT-SolvBTC.BNB | 2.7% | BTC | 0.6% | 16.77% Instead of 2.7% |
3.3 Automated vaults
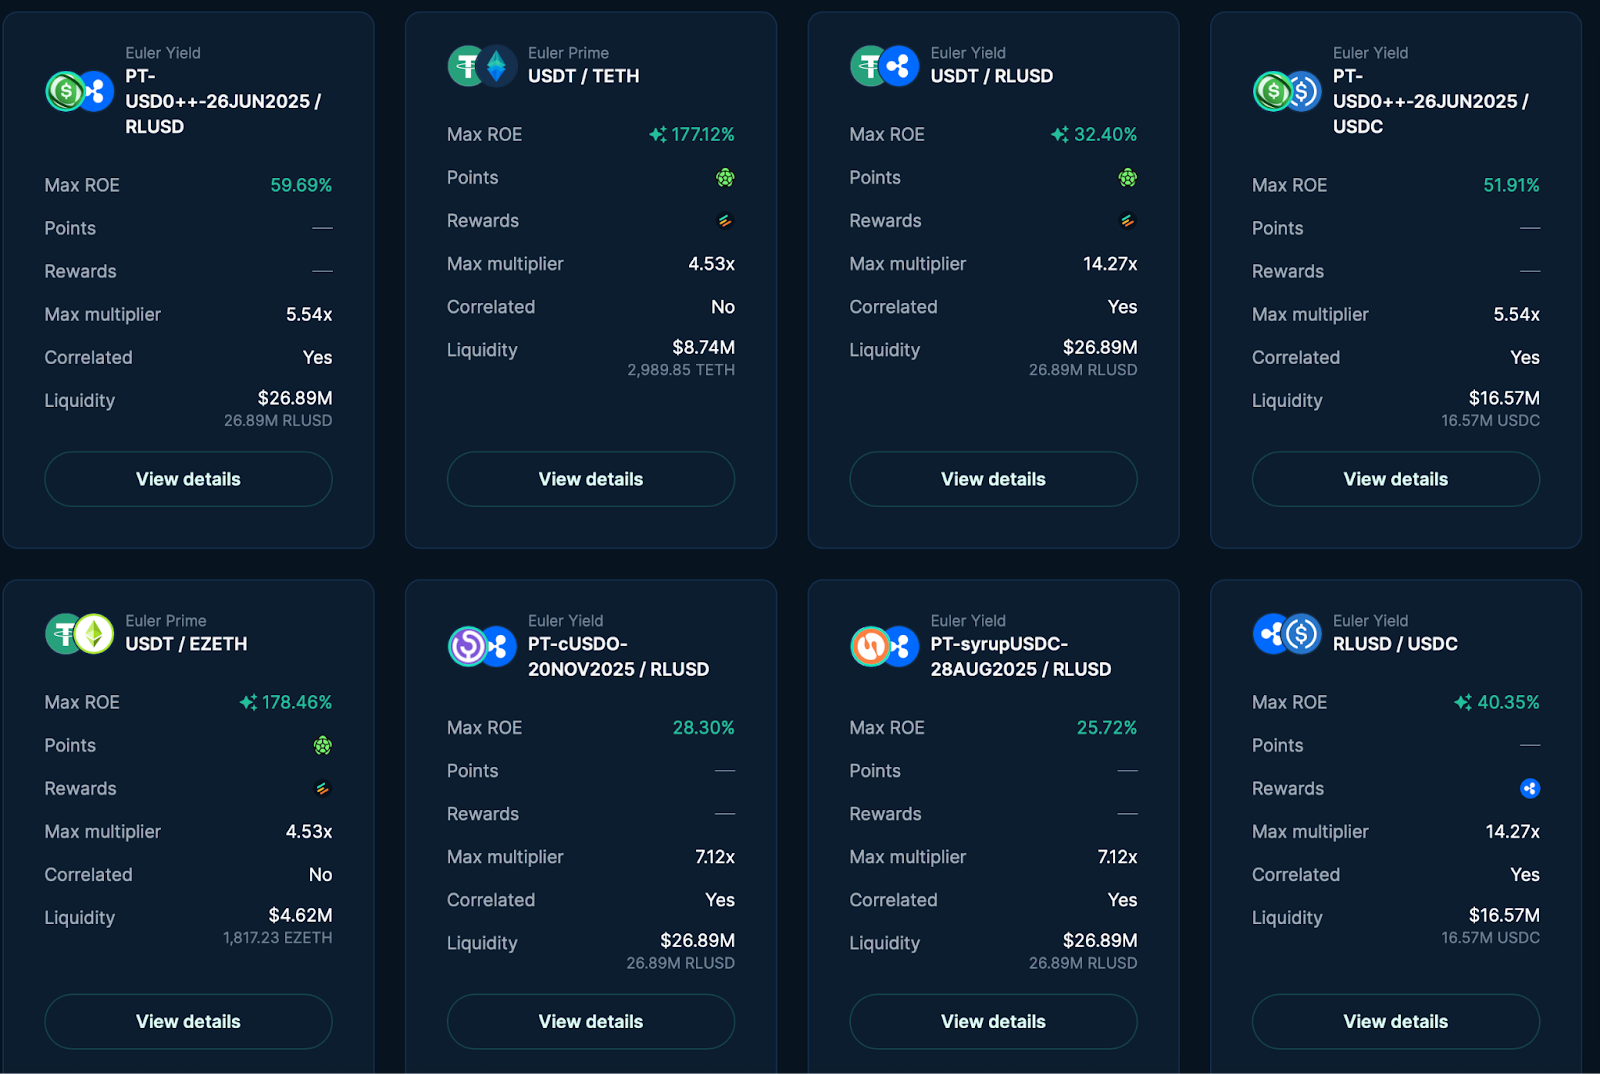
A new product, automated vaults, can be introduced on Venus, utilizing smart contracts to seamlessly implement the strategies outlined above. Additionally, a dashboard can be integrated into the UI to showcase all available strategies and display the maximum ROE achievable through each strategy, similar to the dashboard shown below.
3.4 Intrinsic APY on UI
Display the intrinsic APY of yield-bearing assets, such as staking APY or external rewards from each asset’s yield strategy, to raise greater awareness of the looping opportunities for each asset.
3.5 Merkl Campaigns (Optional)
To ensure dominance of yield-bearing assets on the BNB Chain, we should incentivize the base supply APY of each asset by redirecting incentives from the least-performing assets to the highest-performing ones.
An initial emission amount must be set for each asset at the outset. Below is the recommended emission allocation for assets based on their potential and market popularity on the BNB Chain. However, I advise against incentivizing already mature markets, such as WBETH and SolvBTC.
The recommended daily XVS emission for the first period to test the pools is 426 XVS, distributed as follows:
| Asset name | Recommended daily emission in xvs | Total 28 days emission | Decrease rewards if TVL is under | 25% rewards increase for next period if TVL exceed |
|---|---|---|---|---|
| wstETH | 10 | 280 | TVL<10M | TVL > 12M |
| weETH | 10 | 280 | TVL<10M | TVL > 12M |
| WBETH | 0 | 0 | x | x |
| sUSDe | 70 | 1960 | TVL<50M | TVL > 60M |
| asUSDf | 20 | 560 | TVL<20M | TVL > 24M |
| sUSDx | 10 | 280 | TVL<10M | TVL > 12M |
| xSolvBTC | 0 | 0 | x | x |
| SolvBTC.BNB | 20 | 560 | TVL<20M | TVL > 24M |
| SolvBTC | 0 | 0 | x | x |
| LBTC | 10 | 280 | TVL<15M | TVL > 18M |
| AsBNB | 0 | 0 | x | x |
| SlisBNB | 0 | 0 | x | x |
| PT-sUSDe | 100 | 2800 | TVL<60M | TVL > 70M |
| PT-USDe | 70 | 1960 | TVL<60M | TVL > 70M |
| PT-asUSDf | 25 | 700 | TVL<25M | TVL > 30M |
| PT-asBNB | 20 | 480 | TVL<30M | TVL > 35M |
| PT-ClisBNB | 20 | 480 | TVL<30M | TVL > 35M |
| PT-xSolvBTC | 20 | 480 | TVL<20M | TVL > 25M |
| PT-SolvBTC.BNB | 30 | 840 | TVL<40M | TVL > 50M |
PS: the revenue generated is expected to be greater than the emission spent.
4.1 TVL gain forecast
There will be multiple factors contributing to the TVL growth during this period, in order to do a proper TVL gain forecast, we must understand the main factors that will be contributing to the TVL growth such as:
The TVL that comes directly from depositing the yield bearing assets on Venus
This one is pretty straight forward, Venus will be gaining TVL from the different yield bearing assets that is newly deployed, for example today SolvBTC contributes more than 100M in TVL on the core pool.
The TVL that comes from looping those assets multiple times until they reach max APY
The main drive behind TVL growth should be users looping their assets to maximize their gains, this will depend mainly on the amount of idle liquidity on the protocol and the IR curve, if IR curve is optimized correctly, both suppliers and borrowers will have favourable rates to enjoy, and the protocol will be gaining more revenue due to high utilization.
The TVL that comes from higher APY on the core assets (BNB,BTC,ETH,USD)
When users loop their assets, the utilization of the core assets such as BNB and ETH will start to go up, which will trigger higher supply APY for those assets, which will be attractive for liquidity providers to come in and supply their assets for easy relaxing supply APY, the best example of this is AAVE, after adopting the PT-sUSDe strategy, they managed to add more than 1.8B in stablecoins liquidity since the rates for USD suppliers is always moderate.
Ideal End Game TVL Forecast Table
| 1.1 Target pools | 1.2 Loop-able with | 1.3 Convertible idle liquidity to TVL | TVL gained from the loop = 1.3 * 1,15 |
|---|---|---|---|
| BTC | PT-xSolvBTC,PT-SolvBTC.BNB,xSolvBTC, SolvBTC.BNB, SolvBTC, LBTC. | 693M | 797M |
| BNB | AsBNB, SlisBNB, PT-asBNB, ClisBNB. | 207M | 238M |
| USDT | PT-sUSDe, PT-USDe, PT-asUSDf, sUSDe, asUSDf, sUSDx. | 106M | 122M |
| USDC | PT-sUSDe, PT-USDe, PT-asUSDf, sUSDe, asUSDf, sUSDx. | 44M | 51M |
| ETH | weETH, wstETH, WBETH | 37M | 43M |
| FDUSD | PT-sUSDe, PT-USDe, PT-asUSDf, sUSDe, asUSDf, sUSDx. | 9M | 11M |
If everything goes as planned and the strategies work out, Venus should see a total of 2.35B in TVL, as absurd as this number sounds, if we look at competitors, we can see that they have done a lot more than this, as mentioned earlier, AAVE has obtained more than 14B following this strategy, so 2.35B is a good start, if in disbelief, feel free to discuss everything in the comment section below and I will clear your doubts.